Full Report
The numbers behind Dingdong (Cayman) Limited: as-reported financial statements and company metrics for FY2021–FY2025, traced to the source filings. Every linked figure opens the exact page of the filing it was printed on, with the statement row highlighted. Amounts in RMB millions (¥) unless noted.
Reading notes: Reporting currency is RMB (Renminbi); the company files under U.S. GAAP as a foreign private issuer (Form 20-F). All figures are in RMB millions as filed (the filings print thousands of RMB; values here are divided by 1,000 and rounded). The filings also show a US$ convenience translation, which is not used here. Shares trade on the NYSE as ADSs (2 ADS = 3 ordinary shares) in USD. Each fiscal year is cited to the most recent 20-F that presents it on a consistent (post-reclassification) basis: FY2023–FY2025 income cash-flow columns from the FY2025 20-F; FY2022 from the FY2024 20-F; FY2021 from the FY2023 20-F. Balance sheets: FY2024–FY2025 from the FY2025 20-F, FY2022–FY2023 from the FY2023 20-F, FY2021 from the FY2022 20-F. Per-ordinary-share amounts are as printed. FY2021 basic/diluted loss per share of RMB(34.50) reflects the low pre-IPO weighted-average share count (194.7mn) plus preferred-share accretion in the IPO year and is not comparable with later years. Long-Term Record: FY2019–FY2020 total revenue and net loss are taken from the FY2021 20-F (Form 20-F, three-year comparative columns). FY2019 diluted EPS and FY2019 operating cash flow are omitted (pre-IPO share structure / not extracted). FY2020 operating cash flow is from the FY2022 20-F.
FY2025 at a Glance
Revenue (RMB millions (¥))
Diluted EPS
Source: FY2025 consolidated statements [1] [2] [3]. Click any linked figure to open the filing page with the row highlighted.
Revenue by Type
| Revenue by Type | FY2021 | FY2022 | FY2023 | FY2024 | FY2025 |
|---|---|---|---|---|---|
| Product revenues | 19,897 | 23,939 | 19,721 | 22,743 | 24,018 |
| Service revenues | 224 | 282 | 250 | 323 | 342 |
| Total revenues | 20,121 | 24,221 | 19,971 | 23,066 | 24,360 |
| Total revenues growth, derived | — | +20.4% | -17.5% | +15.5% | +5.6% |
Source: Consolidated Statements of Comprehensive (Loss)/Income — disaggregation of revenue (Note 3) [1] [2] [3]. Click any linked figure to open the filing page with the row highlighted.
Income Statement
Source: Consolidated Statements of Comprehensive (Loss)/Income [1] [2] [3]. Click any linked figure to open the filing page with the row highlighted.
Columns marked E are consensus analyst estimates shown alongside reported results for direct comparison; they are not company guidance.
Estimate source: Yahoo Finance analyst consensus, as of 2026-07-19. Estimate figures link to the consensus source, not to filing pages.
Balance Sheet
| Balance Sheet | FY2021 | FY2022 | FY2023 | FY2024 | FY2025 |
|---|---|---|---|---|---|
| Cash and cash equivalents | 663 | 1,856 | 1,209 | 887 | 1,107 |
| Short-term investments | 4,568 | 4,637 | 4,100 | 3,562 | 2,870 |
| Inventories, net | 537 | 605 | 472 | 554 | 570 |
| Total current assets | 6,516 | 7,496 | 6,151 | 5,365 | 5,040 |
| Property and equipment, net | 472 | 315 | 189 | 176 | 233 |
| Operating lease right-of-use assets | 2,246 | 1,425 | 1,262 | 1,465 | 1,580 |
| Total assets | 9,420 | 9,382 | 7,699 | 7,118 | 7,016 |
| Accounts payable | 2,059 | 1,887 | 1,422 | 1,660 | 1,920 |
| Short-term borrowings | 3,121 | 4,238 | 3,300 | 1,606 | 872 |
| Total current liabilities | 7,349 | 8,211 | 6,506 | 5,270 | 4,795 |
| Total liabilities | 8,662 | 8,964 | 7,200 | 6,194 | 5,840 |
| Total shareholders' equity | 728 | 310 | 383 | 799 | 1,041 |
Source: Consolidated Balance Sheets (as of December 31) [4] [5] [6] [7]. Click any linked figure to open the filing page with the row highlighted.
Cash Flow
| Cash Flow | FY2021 | FY2022 | FY2023 | FY2024 | FY2025 |
|---|---|---|---|---|---|
| Net cash (used in)/generated from operating activities | (5,667) | 87 | (235) | 929 | 536 |
| Purchases of property and equipment | (452) | (127) | (83) | (98) | (178) |
| Net cash (used in)/generated from investing activities | (4,065) | (47) | 519 | 476 | 430 |
| Repurchase of ordinary shares | (3) | (18) | 0 | (31) | (9) |
| Net cash generated from/(used in) financing activities | 9,043 | 1,112 | (934) | (1,724) | (743) |
| Net increase/(decrease) in cash and cash equivalents and restricted cash | (780) | 1,189 | (649) | (319) | 217 |
| Free cash flow, derived | (6,119) | (40) | (318) | 831 | 358 |
Source: Consolidated Statements of Cash Flows [8] [9] [10] [11]. Click any linked figure to open the filing page with the row highlighted.
Marketplace Scale Fulfillment Network
| Marketplace Scale Fulfillment Network | FY2021 | FY2022 | FY2023 | FY2024 | FY2025 |
|---|---|---|---|---|---|
| GMV (gross merchandise value) | 22,704 | 26,248 | 21,969 | 25,557 | 26,436 |
| Average order value (RMB per order) | 58.7 | 74.5 | 72.1 | 71.4 | 70.1 |
| Frontline fulfillment stations | 1,300 | 1,100 | 1,000 | 1,000 | 1,100 |
| Cities covered | 35 | 30 | 25 | 25 | 28 |
| Regional processing centers | 60 | 60 | 45 | 40 | 40 |
Source: company filings [12] [13] [14] [15]. Click any linked figure to open the filing page with the row highlighted.
Private-Label Program
| Private-Label Program | FY2021 | FY2022 | FY2023 | FY2024 | FY2025 |
|---|---|---|---|---|---|
| Private-label share of total GMV | — | 16.0% | 20.0% | 20.0% | 20.0% |
| Private-label SKUs | — | 2,200 | 3,000 | 4,000 | 5,000 |
| Private-label brands launched (cumulative) | — | 20 | 30 | 30 | 23 |
Source: company filings [16] [17] [18] [19]. Click any linked figure to open the filing page with the row highlighted.
Profitability Quality of Earnings
| Profitability Quality of Earnings | FY2021 | FY2022 | FY2023 | FY2024 | FY2025 |
|---|---|---|---|---|---|
| Non-GAAP net (loss)/income | (6,114) | (571) | 45 | 423 | 310 |
| Non-GAAP net (loss)/income margin | (30.4%) | (2.4%) | 0.2% | 1.8% | 1.3% |
| Government subsidies recognized (operating + non-operating) | 16.8 | 15.0 | 18.1 | 61.0 | 87.4 |
Source: company filings [20] [13] [21] [22]. Click any linked figure to open the filing page with the row highlighted.
Long-Term Record
| Fiscal year | Total revenues | Net (loss)/income | Diluted (loss)/earnings per ordinary share | Net cash from operating activities |
|---|---|---|---|---|
| FY2019 | 3,880 | (1,873) | — | — |
| FY2020 | 11,336 | (3,177) | — | (2,056) |
| FY2021 | 20,121 | (6,429) | (34.50) | (5,667) |
| FY2022 | 24,221 | (807) | (2.51) | 87 |
| FY2023 | 19,971 | (91) | (0.31) | (235) |
| FY2024 | 23,066 | 304 | 0.90 | 929 |
| FY2025 | 24,360 | 232 | 0.66 | 536 |
Source: consolidated statements across filings; older years from the standardized feed [9] [1] [11] [2]. Click any linked figure to open the filing page with the row highlighted.
Operating KPIs
| KPI | FY2021 | FY2022 | FY2023 | FY2024 | FY2025 |
|---|---|---|---|---|---|
| GMV (gross merchandise value) | 22,704.1 | 26,247.9 | 21,969.3 | 25,557.4 | 26,436.2 |
Source: company-reported operating metrics [13] [23]. Click any linked figure to open the filing page with the row highlighted.
Analyst Consensus
Current price
Mean target
Median target
High target
Low target
Estimate source: Yahoo Finance analyst consensus, as of 2026-07-19. Estimate figures link to the consensus source, not to filing pages.
Traceability
288 of 289 figures on this page (100%) link to the filing page where they are printed — click a linked figure to open the source PDF at that page with the row highlighted. Unlinked figures come from standardized data feeds or pre-filing years.
Reporting currency is RMB (Renminbi); the company files under U.S. GAAP as a foreign private issuer (Form 20-F). All figures are in RMB millions as filed (the filings print thousands of RMB; values here are divided by 1,000 and rounded). The filings also show a US$ convenience translation, which is not used here. Shares trade on the NYSE as ADSs (2 ADS = 3 ordinary shares) in USD.
Each fiscal year is cited to the most recent 20-F that presents it on a consistent (post-reclassification) basis: FY2023–FY2025 income cash-flow columns from the FY2025 20-F; FY2022 from the FY2024 20-F; FY2021 from the FY2023 20-F. Balance sheets: FY2024–FY2025 from the FY2025 20-F, FY2022–FY2023 from the FY2023 20-F, FY2021 from the FY2022 20-F.
Per-ordinary-share amounts are as printed. FY2021 basic/diluted loss per share of RMB(34.50) reflects the low pre-IPO weighted-average share count (194.7mn) plus preferred-share accretion in the IPO year and is not comparable with later years.
Long-Term Record: FY2019–FY2020 total revenue and net loss are taken from the FY2021 20-F (Form 20-F, three-year comparative columns). FY2019 diluted EPS and FY2019 operating cash flow are omitted (pre-IPO share structure / not extracted). FY2020 operating cash flow is from the FY2022 20-F.
Quarterly block covers the whole group on a consistent basis (Q1 FY2024–Q4 FY2025), income statement only; each quarter is a single three-month period taken from that quarter's earnings release (unaudited). NOTE: beginning Q1 FY2026 the company reclassified its China business as discontinued operations (planned disposal; overseas business = continuing operations), which breaks comparability with these periods, so Q1 FY2026 is deliberately excluded from the quarterly series.
Segment reporting: the CODM manages the business as a single reportable segment; revenue is disaggregated only into Product revenues and Service revenues (the revenue-breakdown table above), so no separate segment-profit statement is presented.
GMV (gross merchandise value) is an operating metric disclosed in Item 5 of each 20-F; it is larger than reported revenue and is shown as a KPI in RMB millions.
3 figure(s) differed between the data feed and the filing; the filing value is shown (see the run's metrics/metrics_tab.json for the audit trail).
Dingdong (Cayman) Limited's management explains the business in its own materials. The slides below do the most of that work, pulled from the documents preserved in Sources. Each source link opens the complete presentation at that slide in a new tab.
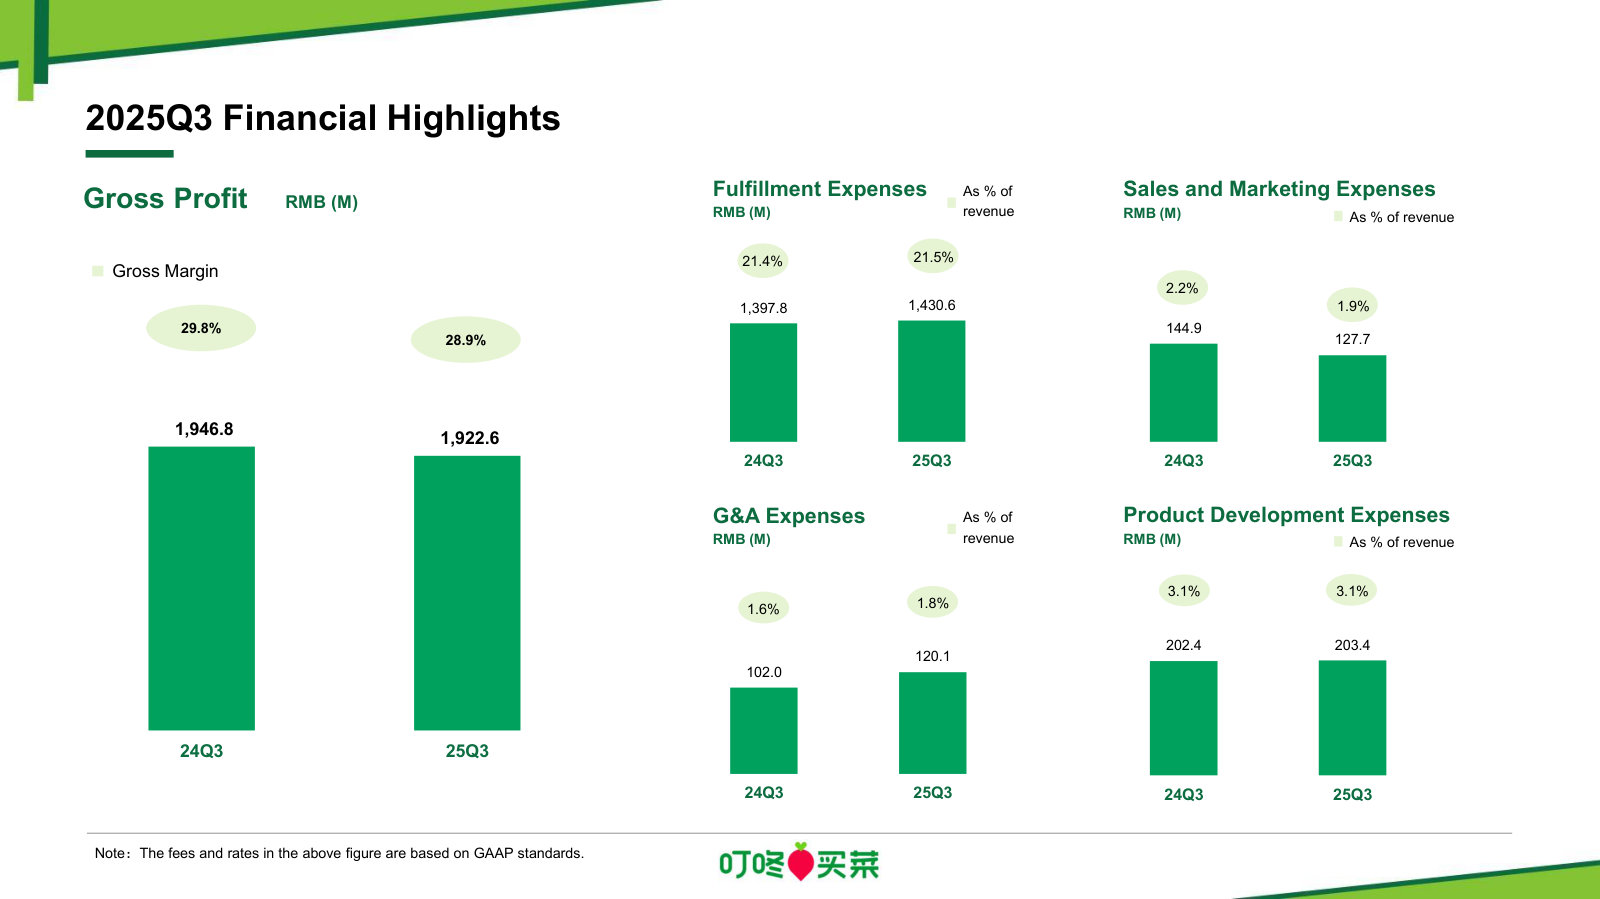
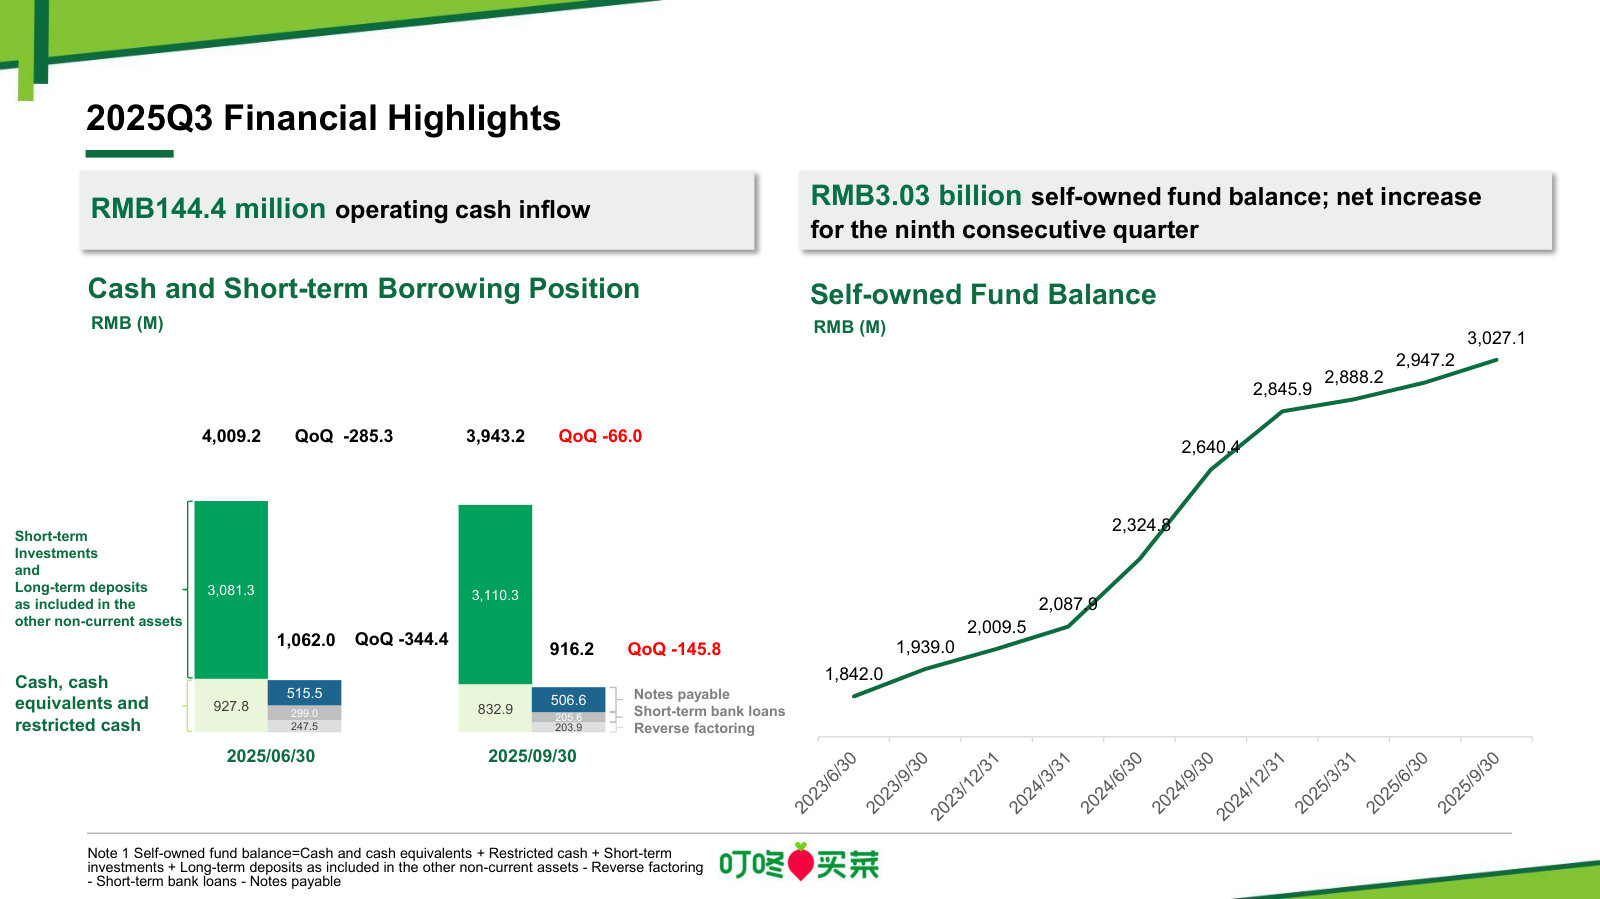
2025 Q3 Results — Q3 2025
The latest quarterly deck — current scale, unit economics, cost structure and the One Big/One Small/One World strategy in one place. · Open the full document →
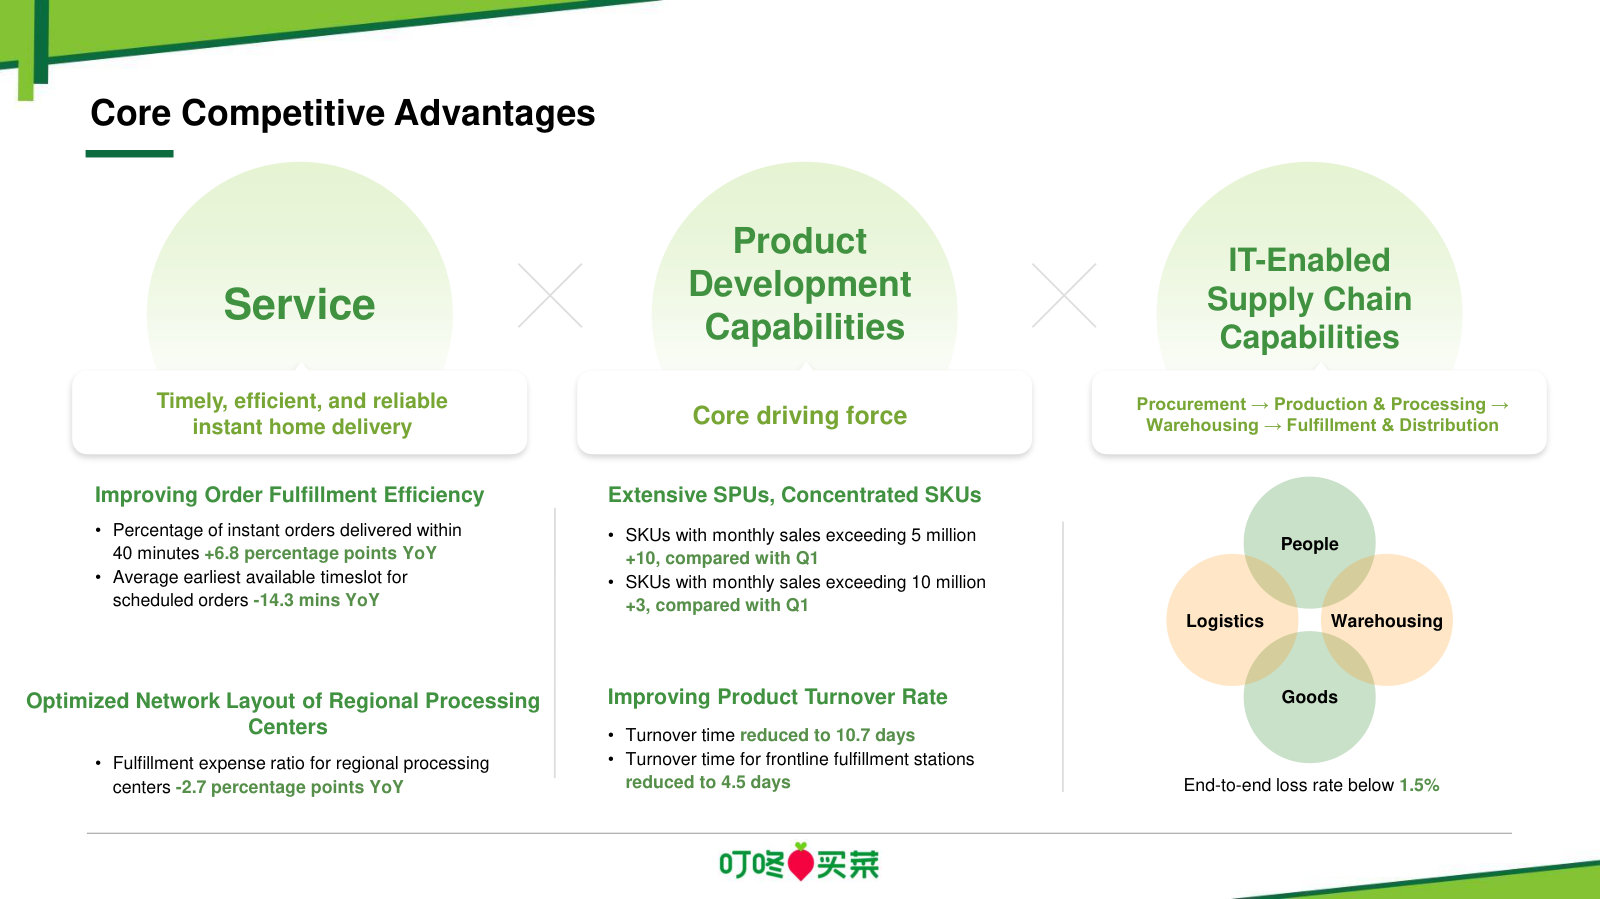
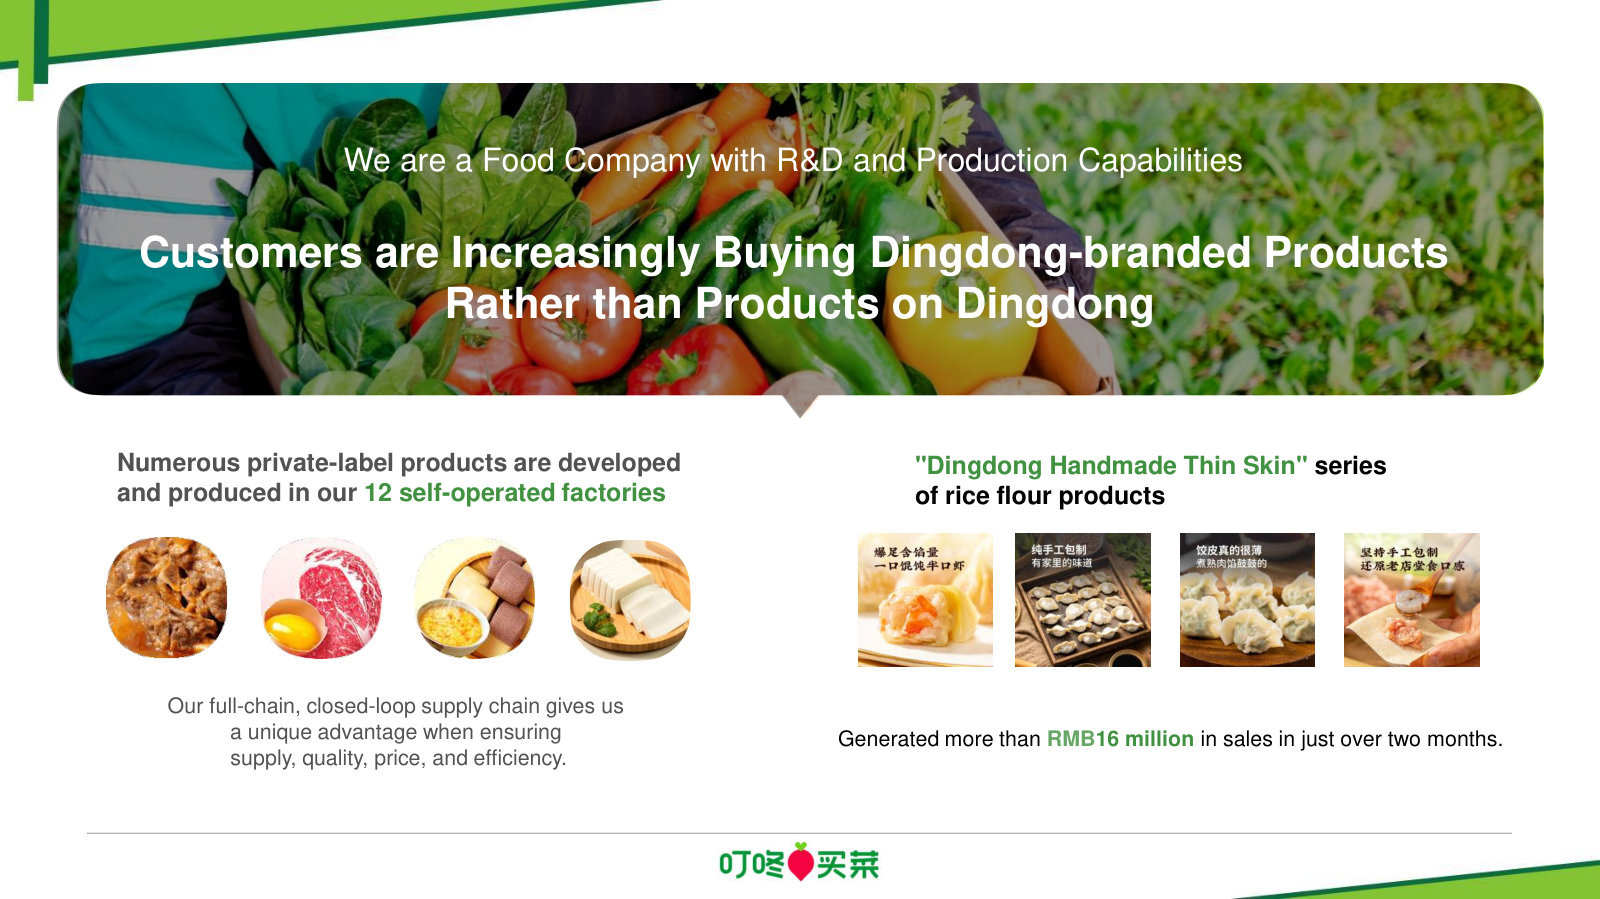
2023 Q3 Results — Q3 2023
Where management explains what Dingdong actually is — a vertically integrated food company, not just a delivery app. The clearest statement of the model. · Open the full document →
2023 Q2 Results — Q2 2023
Two operating slides the later decks stopped showing: the economics of membership and how the supply chain is actually run. · Open the full document →
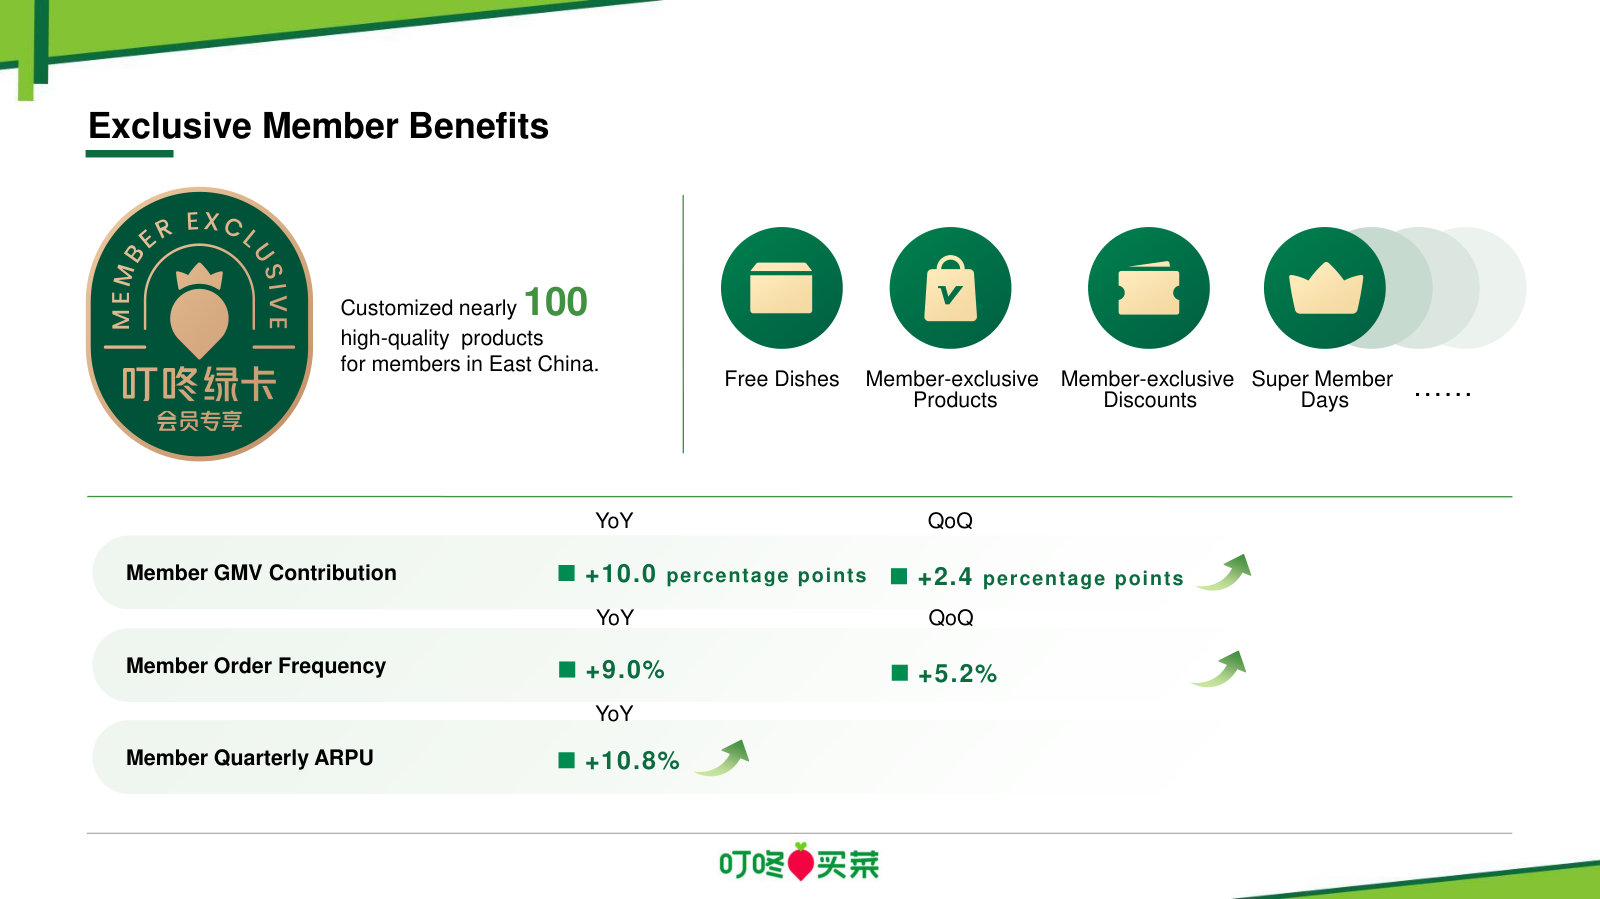
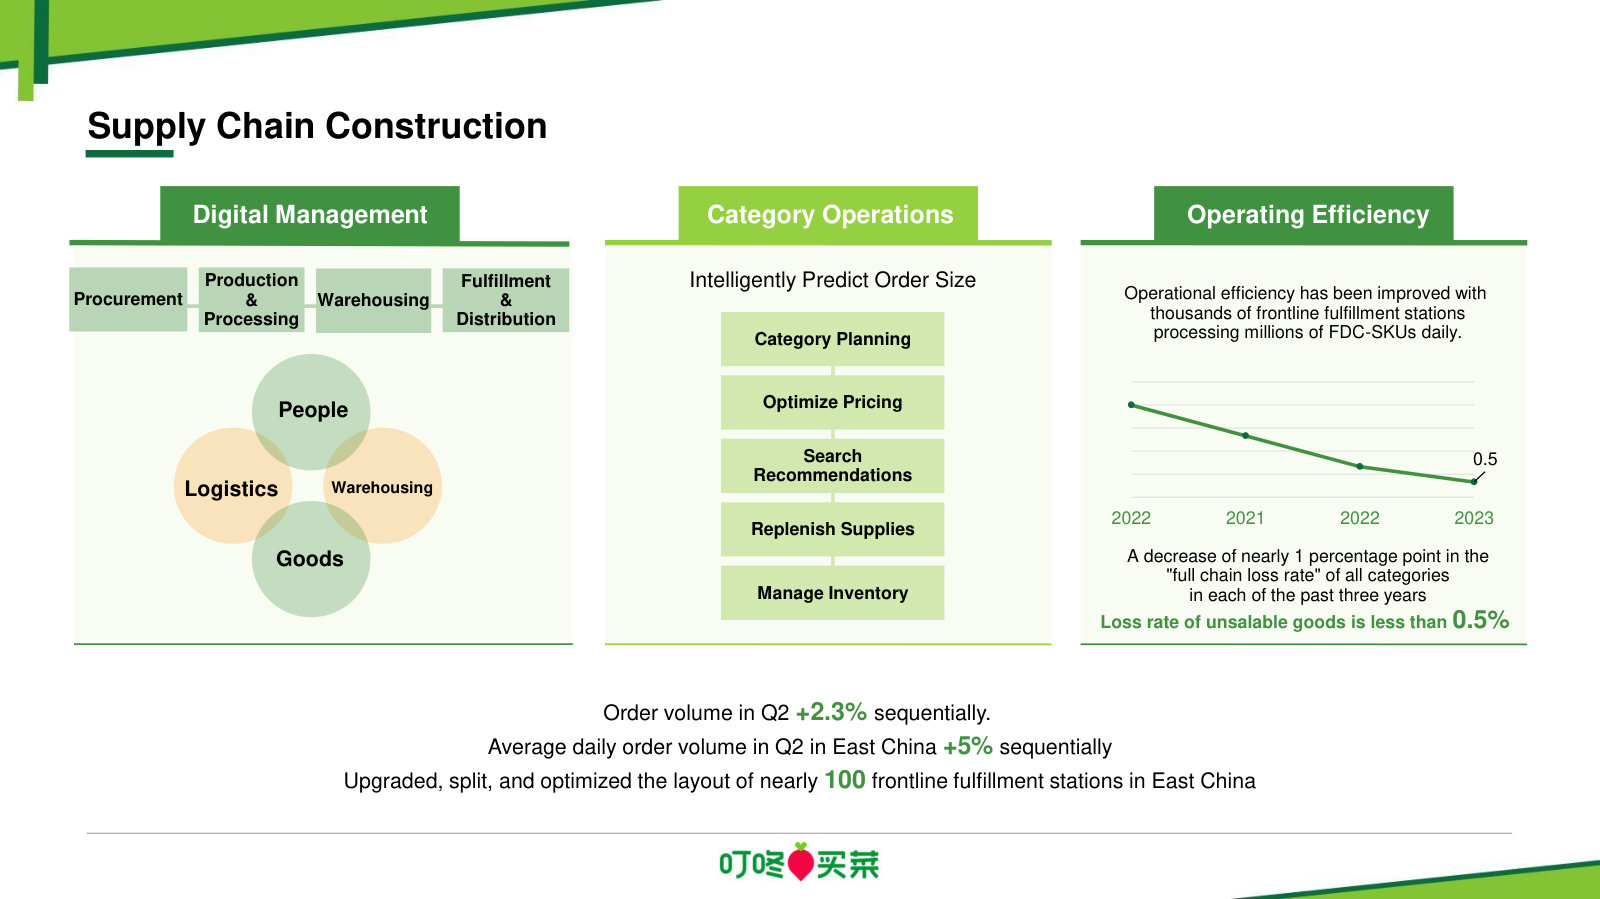
More from management
2025 Q1 Results — Q1 2025 · 11 pages · The 4G strategy (good users, products, services, mindshare) and ecosystem framing that precedes the current One Big/One Small/One World language. · Open →
2024 Q3 Results — Q3 2024 · 10 pages · The record quarter — GMV +28% YoY and non-GAAP profit up nearly 10x — the inflection to which recent results are compared. · Open →
2024 Q2 Results — Q2 2024 · 11 pages · Management's articulation of future growth drivers: deepening Jiangsu/Zhejiang/Shanghai and reusing spare supply-chain capacity. · Open →
2024 Q1 Results — Q1 2024 · 10 pages · A cleaner, later restatement of the supply-chain thesis — end-to-end efficiency as the fundamental principle for the fresh-grocery business. · Open →
2023 Q4 and Full-Year Results — Q4/FY2023 · 10 pages · The full-year 2023 wrap-up — first year of sustained non-GAAP profitability and the private-label penetration picture. · Open →
Dingdong (Cayman) Limited's management answers for the business every quarter. These are the exchanges that explain it best — verbatim, from the call transcripts preserved in Sources. Each link opens the full transcript at that page in a new tab.
Q3 FY2025 Earnings Call — Q3 FY2025
The most recent call: how Dingdong plans to grow through an intensifying price war — the "One Big, One Small, One World" framework and the top-selling-product model, in management's own words. · Open the full transcript →
How the "Good Products" system compounds retention, order frequency and GMV.
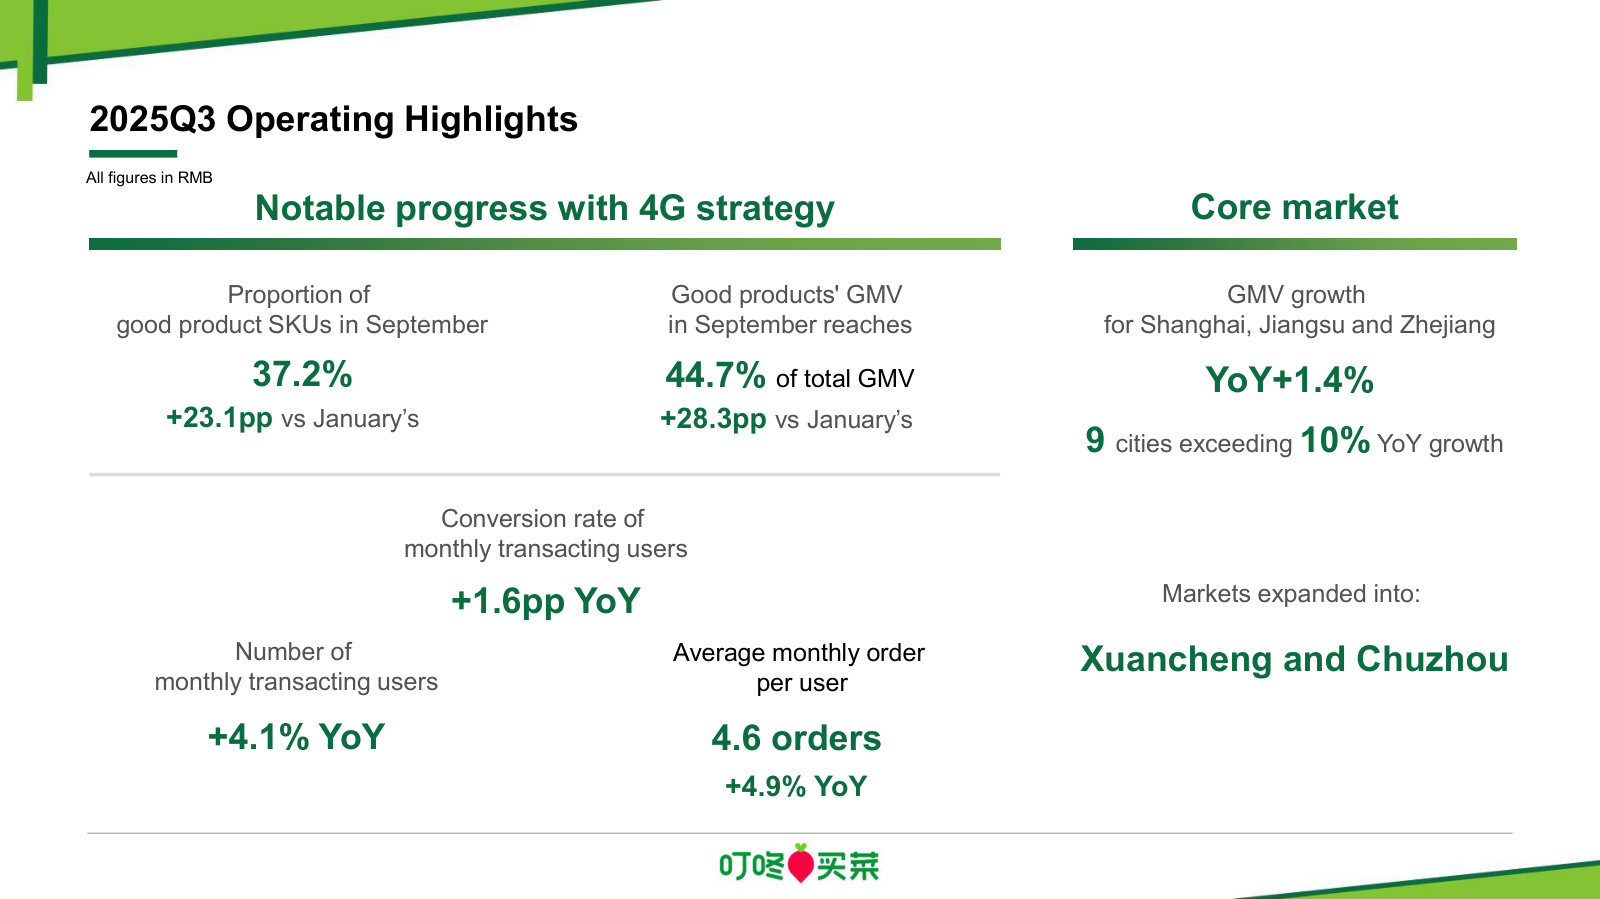
Changlin Liang (Founder & CEO): This year, the company has made notable progress with its "Good Products" system. A series of good products has effectively enhanced user retention and repurchase rates, while also significantly supporting overall GMV growth. For instance, in September, SKUs classified as "Good Products" comprised 37.2%, generating 44.7% of total GMV—a rapid jump from January, when the 4G strategy was launched, and the share of Good Products SKUs was 14.1% and their GMV contribution was 16.4%. The growing number of these "Good Products" has attracted more users to place orders on Dingdong. In Q3, the monthly order conversion rate increased by 1.6 percentage points year-over-year, and the number of monthly ordering users grew by 4.1%. Additionally, "Good Products" have further strengthened user mindshare. The average monthly order frequency reached a record 4.6 times in Q3—up 4.9% year-over-year with member placing an average of 7.7 orders per month, a 1.3% year-on-year increase.
p. 2 · Read in context →
Where the money comes from: flat GMV, B2B up 67%, and margin managed by design.
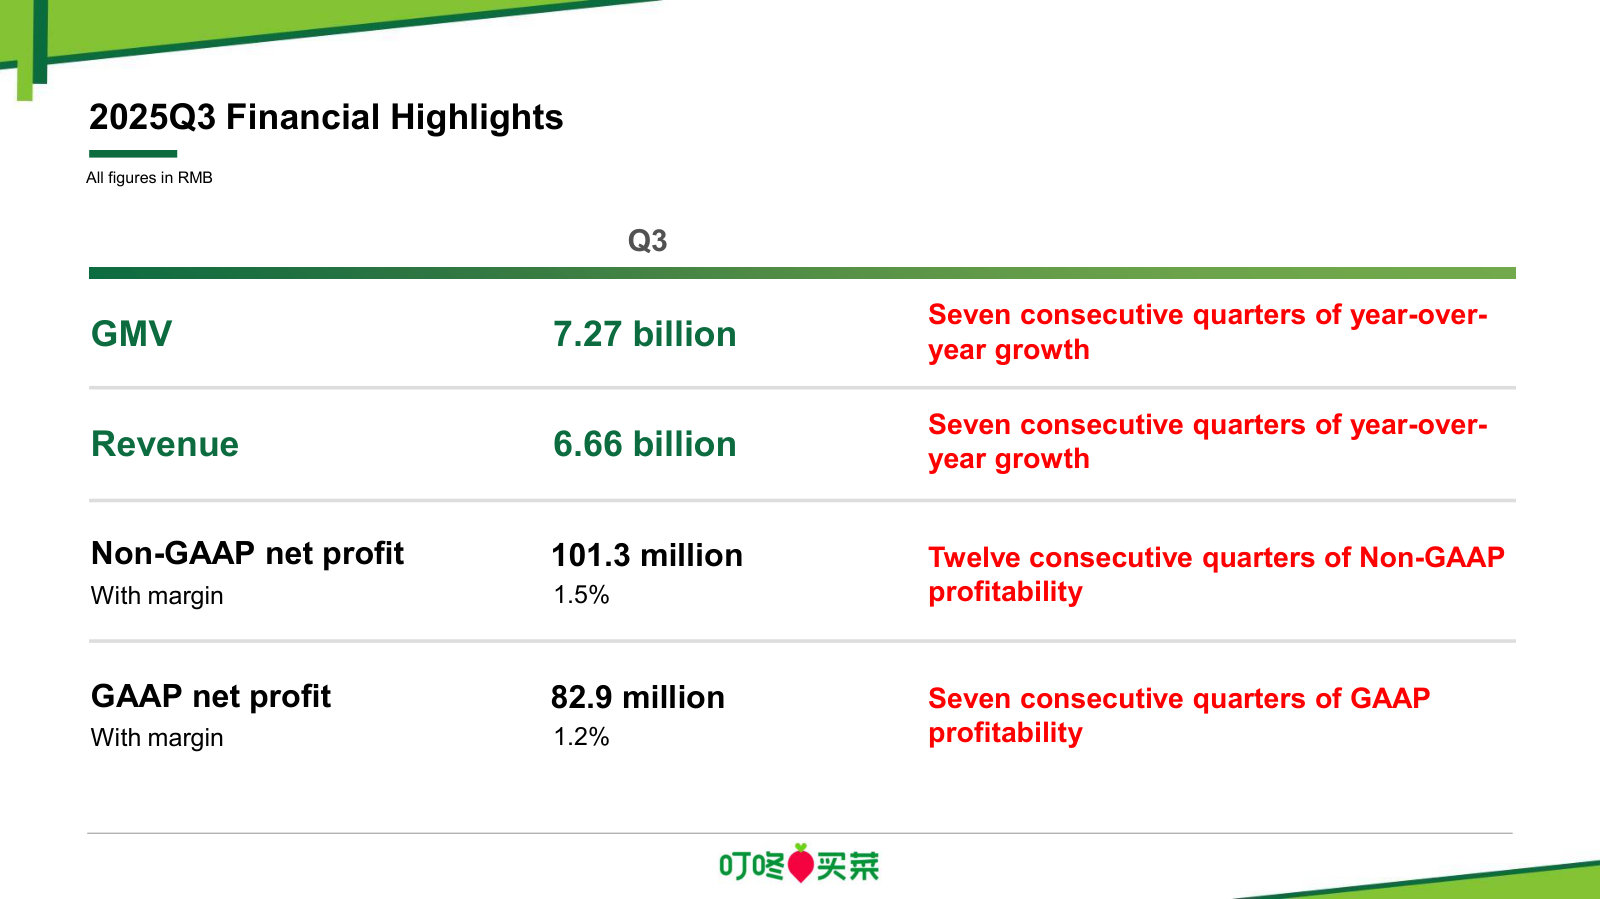
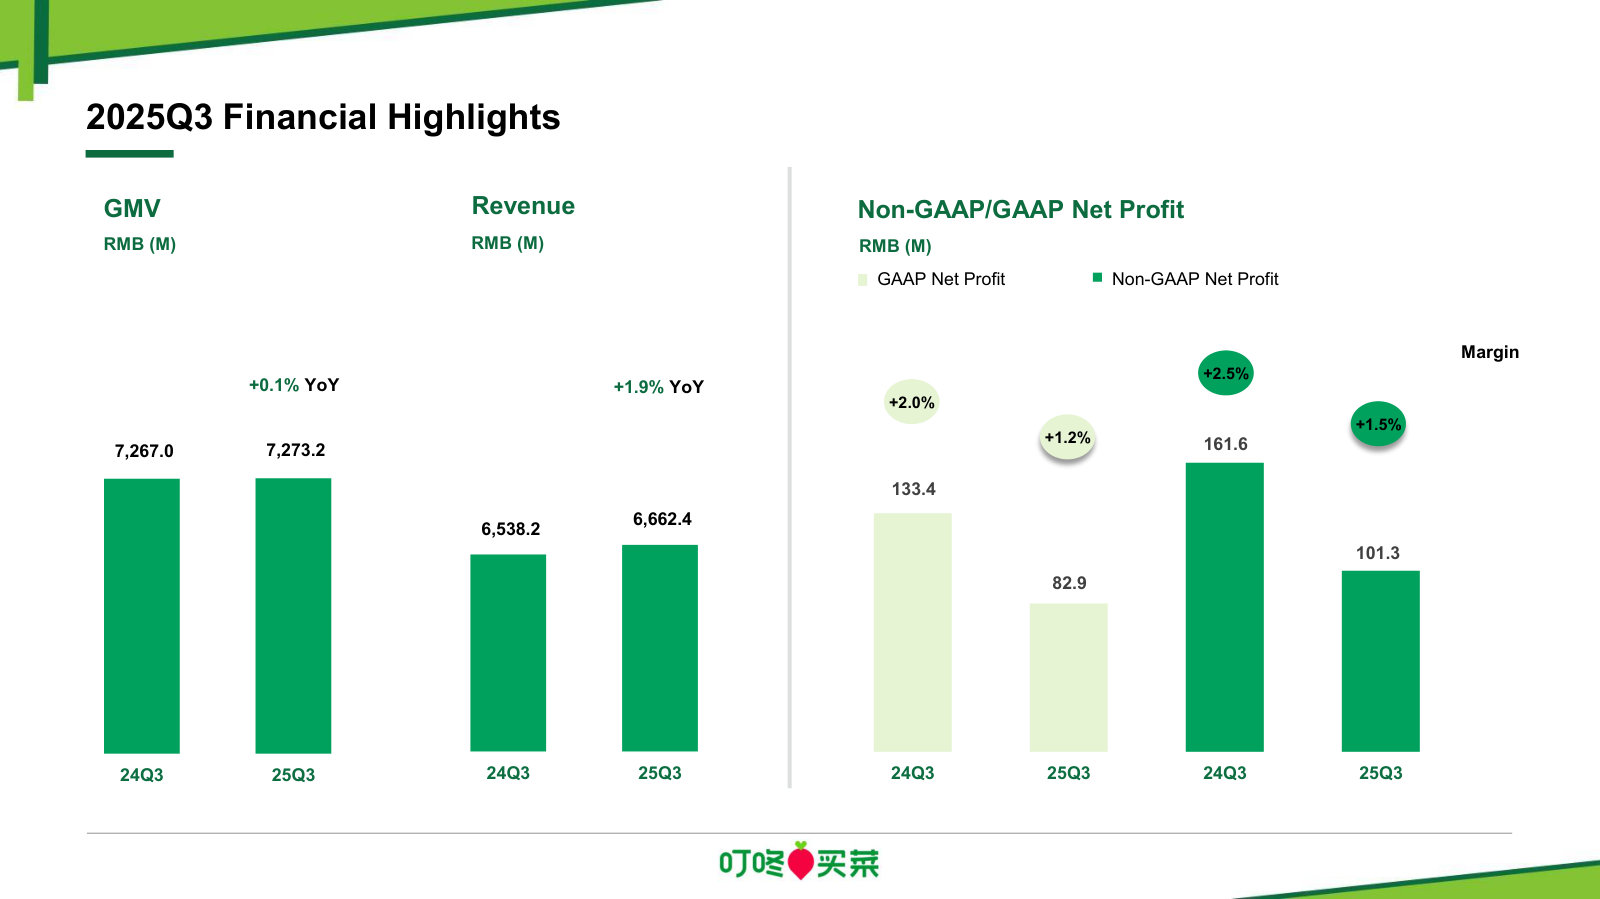
Song Wang (CFO): Revenue for Q3 reached RMB 6.66 billion, marking a 1.9% year-on-year increase. GMV was RMB 7.27 billion, up 0.1% compared to the previous year. The scale growth mainly stemmed from a general rise in order volume, which increased by 2.2% year-on-year in Q3. This quarter, our B2B business continued to grow steadily, with revenue expanding by 67.4% year-on-year, and its revenue share rose by 1.9 percentage points year-on-year. […] Gross profit margin was 28.9%, down 0.9 percentage points year-on-year. The decline in gross profit narrowed on a quarter-on-quarter basis. During the quarter, the company maintained its focus on its "good products" strategy by refining its product lineup, emphasizing flagship items, and increasing the supply of high-quality goods. It continued to enhance its supply chain system by prioritizing high-quality products that meet market demand, while systematically phasing out slow-moving items with low user preference. This "high-quality in, low-quality out" approach enabled the company to focus on core categories, thereby enhancing overall product competitiveness.
p. 4 · Read in context →
Q2 FY2025 Earnings Call — Q2 FY2025
The fullest account of the 4G strategy reset — the org redesign, the full-chain AI build-out, and a six-point contrast with the platform rivals. · Open the full transcript →
The operating model in one frame: 85% direct sourcing, omnichannel demand, widening geography.
Changlin Liang (Founder & CEO): First, we strengthened our presence in the supply chain by sourcing over 85% of our fresh produce directly from the origin, including Dingdong Agriculture, Guyu Factory, ten product development divisions, Dingdong Xiaoman origin procurement, and direct sourcing from Australia. This ensured ample product availability – in other words, always stock on hand. Second, on the demand side, we expanded omnichannel sales. Besides our popular Dingdong app, we also served domestic and international KA channels and B2B clients, such as merchants, hotels, travel agencies, restaurants, canteens, and factories. Omnichannel sales boosted sales efficiency and fully showcased the value of our supply chain, leading to "sales success." Lastly, we continuously expanded our operational regions, starting from East China to nationwide coverage, and then gradually entering Southeast Asia, the Middle East, and Central Asia. Looking ahead, we plan to expand into Europe, America, and Africa. These simultaneous efforts across supply chains, channels, and regions formed an interconnected system—"point, line, plane, and solid"—which broke growth barriers and enhanced our core system capabilities and competitiveness.
p. 2 · Read in context →
The full-chain AI strategy — from LLM procurement agents to automated sugar-content testing.
Changlin Liang (Founder & CEO): Dingdong was an early AI adopter and among the first in the industry to extensively embed AI into its business. It now implements a comprehensive full-chain AI strategy across all core business segments. […] Supply Chain Intelligence: We use multimodal technology for smart management and optimization throughout the supply chain, enhancing the accuracy and consistency of mapping between physical and digital environments and ensuring "truth-seeking and traceability" across the entire supply chain. Additionally, a large language model (LLM) agent automates decisions on purchasing, allocation, and promotions, further improving inventory accuracy and system stability. For instance, we developed an automated system for testing fruit sugar content, overhauling the testing process to automate everything from "image recognition to data analysis to system integration," replacing manual data entry. The results are notable: data entry time dropped from 20 seconds to under 3 seconds; accuracy rose significantly to 98.3%, greatly reducing quality disputes caused by human errors; and all test data is automatically synchronized to the system, supporting data analysis and traceability, standardizing data, and boosting management efficiency. This system represents a successful application of intelligent supply chain management in the quality control process.
p. 3 · Read in context →
What the 4G reset actually changed: 10 product divisions, GMV/margin dropped as KPIs, good-user repurchase.
Thomas Chong (Jefferies); Changlin Liang (Founder & CEO): Could you summarize the progress and outcome of the 4G strategy during this period?
Liang Changlin: (Speaking Foreign Language). Thank you for your question. The 4G strategy has been in place for more than six months. During this period, we have refined our production relationships and enhanced productivity, emphasizing "good users, good products, good services, and good mindshare.”
First, we comprehensively restructured our production relationships by dismantling traditional product development centers. We integrated personnel from product development, operations, and quality control to form 10 independent product development divisions, each led by a key executive. This shift enabled the Company to prioritize high-quality products and increase organizational efficiency. Simultaneously, we overhauled resource distribution and performance evaluation methods. During this period, we removed GMV and profit margin as performance metrics, instead emphasizing quality indicators such as the proportion of good products, good users, purchase repeat rate, and negative reviews. […] Our good users show an exceptionally high repurchase rate with at least eight orders monthly per user, compared to the average of 4.4.
p. 5 · Read in context →
Six point-by-point contrasts with the price-war rivals — the clearest statement of the moat.
Yang Bai (CICC); Changlin Liang (Founder & CEO): Since our IPO in 2021, we have been attentive to competition in areas such as community group buying, platform delivery, and frontline fulfillment stations. We have addressed these issues individually in previous quarters. We focus less on competition and more on creating value. Reflecting on this journey, we have stayed consistent and accurate in our understanding and positioning.
First, recent competition within instant retail has garnered widespread attention. The battle for users and traffic is fierce, with many adopting quick, short-term price wars. However, this focus often neglects aspects like supply chains and product development. As we outlined with our strategic approach of "narrower and deep," we differ significantly from typical instant retail companies. […] First, our goal is to develop the supply chain and create an ecosystem, whereas theirs is to compete for more users and traffic.
Second, strategically we emphasize commodity and ecological approaches, unlike their focus on traffic, platform dominance, and market monopolization.
Third, in our relationships with channels we seek win-win cooperation and steady growth, whereas they engage in zero-sum market competition.
Fourth, our interactions with suppliers are collaborative and mutually beneficial, while theirs follow a traditional client-provider model.
Fifth, our business models grow in proportion to our upstream and downstream partners. In contrast, theirs are characterized by a power-law distribution, with a few entities controlling most resources and influence, and becoming oligopolies.
Sixth, we value long-term relationships and patience, unlike their focus on short-term KPIs.
p. 6 · Read in context →
Q2 FY2024 Earnings Call — Q2 FY2024
Return to growth laid bare: the anti-Walmart operating principle, the 0-to-1 / 1-to-10 revenue vision, and hard numbers on new-station unit economics. · Open the full transcript →
Why the Walmart playbook fails in fresh grocery — the first principle Dingdong runs on.
Thomas Chong (Jefferies); Changlin Liang (Founder & CEO): Many in the industry adhere to the traditional retail approach, which is achieving scale by offering low prices and then leveraging that scale to drive down procurement costs and operating expenses. However, we've realized that the first principle of traditional retailing, which has been successful since the Walmart era, is not applicable to the fresh grocery industry.
Instead, the first principle of success is to continuously enhance end-to-end efficiency, to achieve growth at scale, seek profitability and bolster competitiveness. It is crucial that we focus on consistently improving our supply chain capabilities. With these capabilities, we'll be able to serve a larger customer base and meet their evolving needs.
p. 6 · Read in context →
The long-range guidance frame: from 0-to-1 (RMB20bn) to 1-to-10 (RMB100bn) over the next seven years.
Robin Leung (Daiwa); Changlin Liang (Founder & CEO): So would you share what does the future revenue growth rate look like for Dingdong in the future?
Changlin Liang: (Speaking foreign language).
(Translated). In our previous discussion, we highlighted four key drivers for growth. These factors are linked to the organic expansion of our fresh food supply chain capabilities. We’re confident that in the future, these four growth drivers will be able to expand to the same scale as our current business lines or even greater.
Additionally, we have divided Dingdong’s initial development into two stages. The first stage covers the 7-year period from our business's establishment in 2017 to the present, representing the transition from zero to one. During this time, we have achieved profitability and have reached an annual revenue scale of more than 20 billion RMB. Looking ahead, the second stage will encompass the next 7 years, representing the transition from 1 to 10, and we aim to achieve an annual revenue scale of 100 billion RMB. Thank you.
p. 7 · Read in context →
Station unit economics: ~RMB40m capex for 80 stations, breakeven at 500 orders/day, 3–6 month ramp.
Yang Bai (CICC); Song Wang (CFO): Will that increase pressure on the company’s cash flow? […] We estimate that the total CapEx investment for these 80 new stations will be around RMB40 million. Therefore, we have enough self-owned funds to complete their opening without impacting our daily operating funds at all. […] We estimate that the new frontline fulfillment stations in Jiangsu, Zhejiang, and Shanghai can achieve operational breakeven with only 500 orders daily per station. The ramp-up period is about 3 to 6 months. […] Our new frontline fulfillment stations processed an average of 800 orders daily in the first half of this year, and most of them are now breaking even at the operational level.
p. 7 · Read in context →
Q4 FY2023 Earnings Call — Q4 FY2023
The first full year of non-GAAP profit, how private label drives category margins, and the reasoning behind the first buyback. · Open the full transcript →
The full-year milestone: first-ever annual non-GAAP profit on ~RMB20bn revenue, RMB22bn GMV.
Changlin Liang (Founder & CEO): As we consistently implemented our development strategy of efficiency first, with due consideration of scale, we not only achieved non-GAAP profitability for the fifth consecutive quarter, but also marked our first full year of non-GAAP profitability. […] For the full year, our revenue was 19.97 billion RMB, with a GMV of 21.97 billion RMB. Our gross profit margin was 30.7%, and our non-GAAP net profit margin was 0.2%.
p. 2 · Read in context →
How private label drives margin: three brands past 50% of category GMV, with names and repurchase rates.
Changlin Liang (Founder & CEO): Over the past 3 years, we have successfully launched private-label products across three major categories: prepared meals, pork, and soy products, and these three categories of our private labels penetrated over 50% of GMV in 2023. Let me share some examples. First is Cai Chang Qing, a private-label product specializing in prepared home-cooked meals. In 2023, GMV totaled approximately [840] million RMB, a significant increase of 43% from 2022.
In the fourth quarter of 2023, the average number of monthly repurchasing users reached 37%, showcasing the brand's popularity among its customers.
p. 3 · Read in context →
Capital allocation: the US$20m buyback rationale — undervalued stock, ample cash.
Jiajing Chen (CICC); Song Wang (CFO): Dingdong recently announced that the company plans to repurchase up to $20 million of its shares by January 2025. Could you give us more color on this?
Song Wang: (Speaking foreign language).
(Translated). Thank you for your question. As you mentioned, we recently announced a stock repurchase plan that will last 1 year, with a total limit of US$20 million. We expect to begin buying back shares once the blackout period ends following earnings. Our stock is significantly undervalued at the current price, especially in view of our long-term growth prospects. Given our ample cash reserves, buying back stock is an effective way to allocate capital, especially when the stock is undervalued. This program will be beneficial for both the company and its shareholders. […] The key to enhancing the company's overall value lies in our ability to continuously improve our operational capabilities, ensuring sustainable and long-term development.
p. 6 · Read in context →
Q3 FY2023 Earnings Call — Q3 FY2023
The landmark profitability call: the first leading player to turn sustainably profitable, why it calls itself a food company rather than a retailer, and the efficiency math behind it. · Open the full transcript →
The milestone that defined the thesis: first of the leading players to reach sustained profitability.
Changlin Liang (Founder & CEO): Non-GAAP net income margin was 0.3%, marking our fourth consecutive quarter of non-GAAP profitability as we continue to prioritize our strategy of “efficiency first, with due consideration of scale”. In addition, we achieved quarterly profitability on a GAAP basis for the second time since Q4 of 2022.
Sustaining profitability over the past 4 consecutive quarters on a non-GAAP basis is critical for both Dingdong and the industry. First of all, it indicates that we have successfully navigated the difficult macroeconomic and competitive environment we found ourselves in, with many doubting the sustainability of the sector. Second, it reflects the corporate flexibility and adaptability we maintain. With the market continuing to change rapidly, these attributes will remain critical to our long-term sustainability.
Third, among the leading companies competing in the sector, we are the first to achieve profitability. It was a long and difficult journey to get here, but we stuck to our principles and vision, which kept us on the right path. Lastly, having reached the profitability milestone, we are confidently looking to the future, where we will maintain sustainable long-term growth.
p. 2 · Read in context →
"We are a food company": private-label R&D and 12 self-operated factories, not just a retailer.
Changlin Liang (Founder & CEO): We are more than just a retail company; in fact, we are a food company with R&D and production capabilities. Our top priority has always been to provide our customers with unique, high-quality products. As we grow, our customers are not only buying products on Dingdong, they are increasingly buying Dingdong-branded products. We develop and produce private-label products in 12 self-operated factories in addition to cooperating with high-quality upstream suppliers.
p. 4 · Read in context →
The efficiency engine in numbers: 30.4% gross margin, 10.7-day turnover, <1.5% loss, fulfillment -3.5pts.
Song Wang (Head of Finance): In Q3, gross profit margin increased by 0.4 percentage points year-over-year, reaching 30.4%. This was driven by the continuous improvement of our operational capabilities and efficiency as we expanded along the fresh food supply chain. Our “extensive SPUs, concentrated SKUs” strategy allowed us to leverage our supply chain and product development capabilities to create top-selling products while managing slow-moving ones. This approach also helped us improve supply chain efficiency, resulting in a companywide turnover time of only 10.7 days and 4.5 days for frontline fulfillment stations.
Our end-to-end loss rate was kept below 1.5%. This helped us utilize economies of scale, while improving our bargaining power and optimizing our product mix. As a result, our gross profit margin remains stable while maintaining our ability to provide significant value to our users. […] Our fulfillment expense ratio in Q3 was 23.3%, an improvement of 3.5 percentage points compared to the same period last year, reflecting the substantial impact of this year’s optimization measures.
p. 5 · Read in context →
The competitive-landscape answer: a fractured market that can't be monopolized; low prices from efficiency.
Fiona Fan (Jefferies); Changlin Liang (Founder & CEO): The market for fresh groceries in China is vast and fractured; it cannot be monopolized. As a startup, Dingdong is committed to providing value to consumers. We believe that many different business models can thrive in this market.
As discussed earlier, we believe instant-delivery retail will bring the sector back to the basics of providing efficient service, better product development capabilities, and competitive pricing. In today's world, efficiency and low prices are critical factors that everyone considers when making purchasing decisions. Low prices result from an improvement in efficiency, not a compromise in quality. […] As for fresh grocery products, we continue to work directly with farmers on the ground, cutting out numerous intermediaries in the supply chain. For non-fresh products, we have increased the proportion of private-label products and in-house production to boost our gross profit, while attracting consumers with our exceptional products. In essence, our approach entails improving our product supply, maintaining quality control from the source, meeting a diverse range of user needs, and responding promptly to demand.
p. 7 · Read in context →
Cohort retention as the LTV proof: 2017 users average ~6 orders/month, rising with tenure.
Sophia Chi (Daiwa); Changlin Liang (Founder & CEO): In addition, we have found that the longer customers use our service, the more orders they tend to place. On average, users who joined our platform in 2017 place around 6 orders per month, while the 2018 cohort place 5.4 orders per month. This suggests that our existing users are highly loyal and tend to increase their order frequency over time. We are confident that we will achieve sustained growth by meeting consumer needs and retaining users for longer term.
p. 8 · Read in context →
More calls
Q4 FY2024 Earnings Call — Q4 FY2024 · 3 pages · The Q4 and full-year 2024 results and 2025 outlook — but the only available transcript is paywall-truncated to the cover and intro, so the PDF gives headline framing rather than management's full remarks or Q&A. · Open →
Dingdong (Cayman) Limited's annual reports contain management's most considered account of the business. These are the sections, passages and visual pages worth opening in the originals preserved in Sources.
Dingdong (Cayman) Limited — FY2025 Annual Report (Form 20-F) — FY2025
The latest 20-F, and a pivotal one: it discloses the February 2026 agreement to sell substantially all China operations to Meituan. · Open the full document →
Item 3. Key Information — D. Risk Factors — p. 13 · Read the full section →
The two risks that are specific to this business right now: a mid-flight divestiture to Meituan, and the food-safety exposure inherent to fresh grocery.
The Meituan sale risk: deconsolidation, loss of users/key employees, and a five-year non-compete on To-C grocery in Greater China.
The sale of Dingdong Fresh BVI to the Buyer may adversely affect our business, financial condition or results of operations, our relationships with our current and potential users and employees of Dingdong Fresh BVI, and could result in the loss of our users and key employees. The deconsolidation of Dingdong Fresh BVI after the closing of the Transaction may adversely affect our results of operations and future development strategy. Together with the transaction, we and Mr. Changlin Liang have entered into a five-year non-competition and non-solicitation covenant with the Buyer, which may pose potential restrictions to our To-C fresh grocery e-commerce business within the Greater China region and may adversely affect our relationship wit existing partners and may have an adverse effect on our future growth prospects. After the closing and certain customary matters to be completed, there ca be no assurance that we may achieve anticipated strategic benefits.
p. 16 · Read in context →
Food-safety exposure: a 7+1 quality-control process, but pesticide and heavy-metal residues have slipped through before.
Although we have developed end-to-end quality control procedures through our 7+1 Quality Control Procedure across the entire procurement and fulfillment process, we cannot assure you that we can always identify every quality control issue due to potential flaws, loopholes and bugs of our procedures and human errors, and our efforts to patch up or update our quality control procedures may suffer from delays or failures due to external factors not entirely under our control. In addition, there are inherent limitations in sampling inspection of non-standard products such as fresh produce, seafood meats, which may not identify all the defects and flaws. Our business growth and development, which result in increased cooperation with an increasing number of suppliers and business partners, evolving and increasingly complex supply chain, and continued digitalization of the fulfillment process all possess the potential to exacerbate the pressure on our quality control procedures, which are in turn required to be perfected in a timely manner. We have detected and remedied several cases of sub-par products being sold on Dingdong Fresh, e.g. excessive pesticide or heavy metal residues. Despite our rectification efforts, we are unable to entirely rule out the possibility that similar incidents will take place again in the future.
p. 19 · Read in context →
Item 4. Information on the Company — p. 54 · Read the full section →
Management's own description of the model — a self-operated frontline fulfillment grid and direct-sourced private label — and where the Meituan deal terms are set out.
The deal terms: US$717m cash plus up to ~US$997m total from Meituan's buyer; international business retained; pending SAMR clearance.
On February 5, 2026, we entered into a definitive Share Purchase Agreement (the “Share Purchase Agreement”) with Two Hearts Investments Limited (the “Buyer”), a wholly-owned subsidiary of Meituan (HKEX: 3690). Pursuant to the Share Purchase Agreement, we have agreed to sell to the Buyer all issued and outstanding shares of Dingdong Fresh BVI, which holds through a series of wholly-owned and majority equity interest subsidiaries substantially all of our operations in China (the “Transaction”). The Buyer will pay cash consideration of US$717 million in the Transaction. In addition, we will have the right to receive prior to August 31, 2026 total cash not exceeding US$280 million from Dingdong Fresh BVI and its subsidiaries (provided that the total net cash of Dingdong Fresh BVI and its subsidiaries on a consolidated basis as of December 31, 2025 minus such amounts received by us shall not be less than US$150 million). As such, we expect that it will receive up to US$997 million in cash proceeds from the Transaction. Thi amount is subject to certain adjustments, including those based on certain net cash, net working capital and other financial line item thresholds of Dingdong Fresh BVI and its subsidiaries as of certain agreed upon dates. In the event that the net cash of Dingdong Fresh BVI and its subsidiaries on a consolidated basis as of December 31, 2025 minus the amounts received by us as described above is less than US$150 million, the Buyer has the right to adjust the purchase price cash consideration at closing for any such shortfalls. Our international business is not part of the Transaction and will be retained by us following any necessary reorganizational processes to be completed prior to the closing of the Transaction. As of the date of this annual report, th Transaction has not been completed, and is subject to the satisfaction or waiver of various customary conditions set forth in the Share Purchase Agreement, including the receipt of anti-monopoly clearance from the SAMR.
p. 54 · Read in context →
Scale and the 2021 pivot to “efficiency first” — GMV of RMB26.4bn and thirteen straight non-GAAP-profitable quarters.
As a result, we have achieved significant scale in our business, and accumulated a massive and highly active user base. Our GMV increased from RMB21,969.3 million in 2023 to RMB25,557.4 million in 2024, and further increased to RMB26,436.2 million (US$3,780.3 million) in 2025. Starting from the third quarter of 2021, we strategically shifted our focus to “efficiency first with due consideration of scale”, aiming to achieve profitability to maximize our investors’ interests in us. Ever since our strategic shift, we have been focusing on further strengthening our product competitiveness while optimizing our fulfillment network, so as to increase user stickiness and secure their loyalty with us. Guided by the strategy, we have achieved non-GAAP profitability for thirteen consecutive quarters and GAAP profitability for eight consecutive quarters.
p. 55 · Read in context →
Item 5. Operating and Financial Review and Prospects — p. 85 · Read the full section →
Where management explains a thin-margin scale business: revenue growth drivers and the cost ratios that decide whether it makes money.
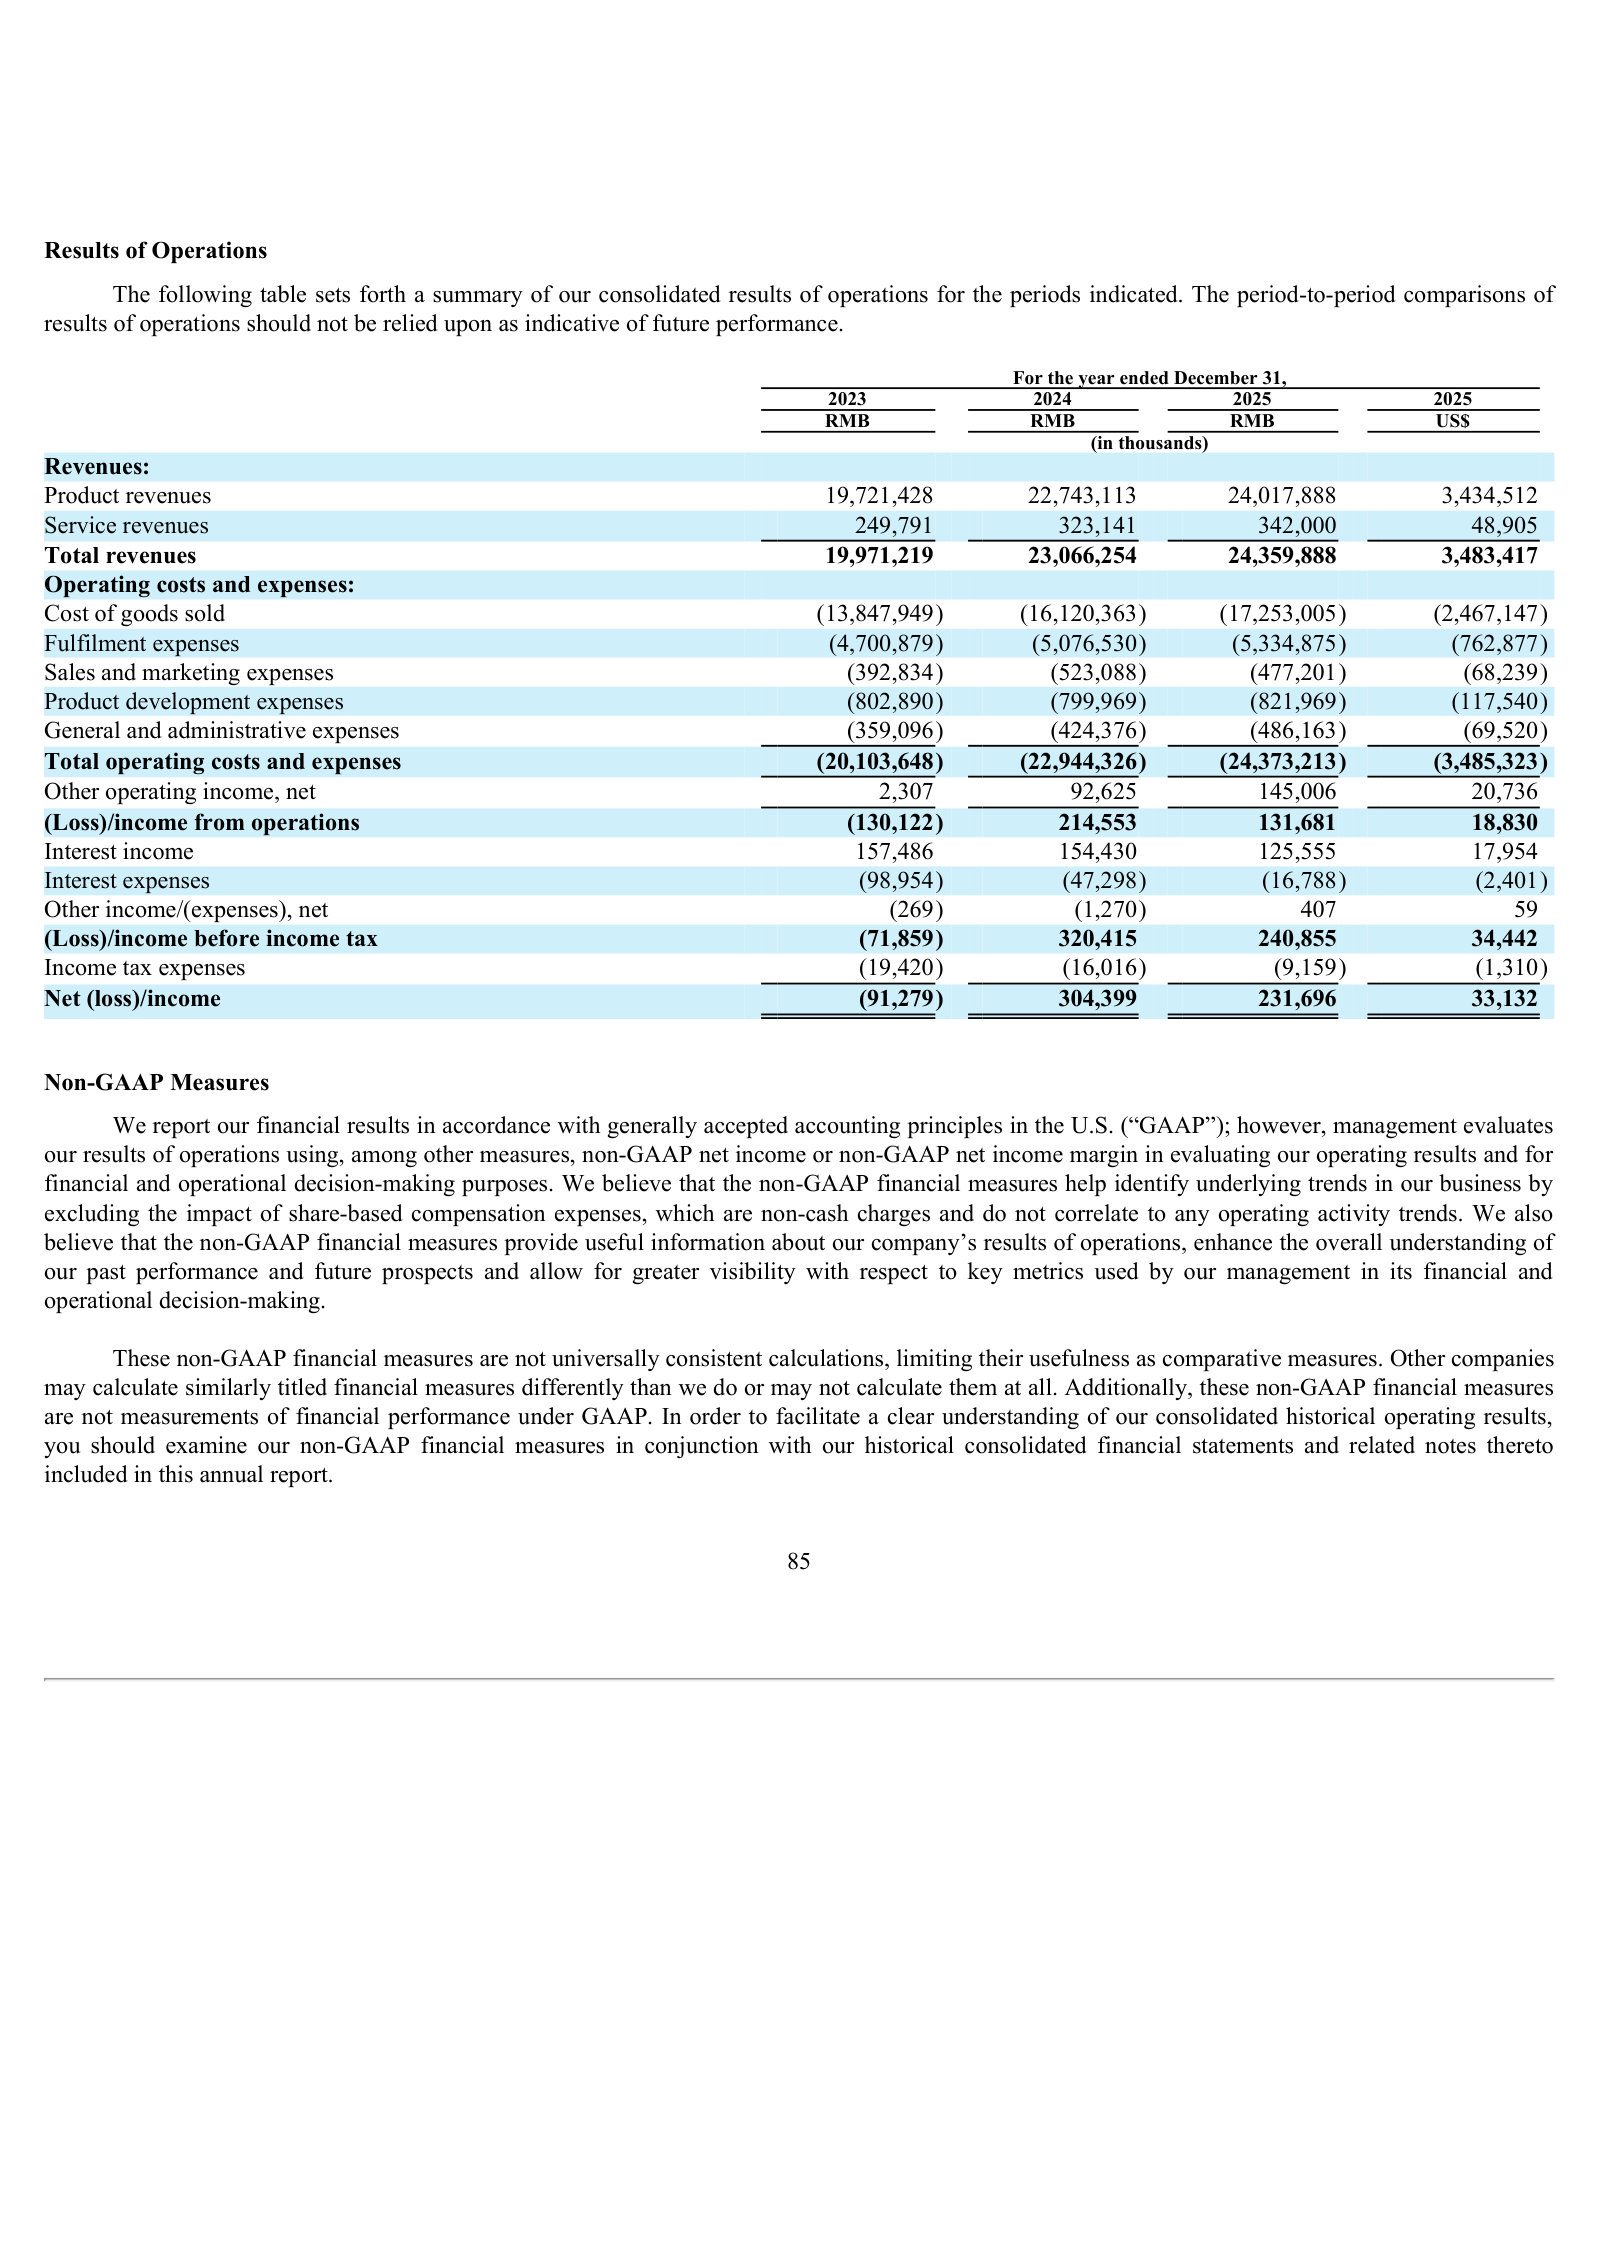
What drove FY2025 revenue (+5.6%): more orders, higher order frequency, new East-China stations, and growing overseas B2B.
Our revenues increased from RMB23,066.3 million in 2024 to RMB24,359.9 million (US$3,483.4 million) in 2025.
Product revenues. Product revenues increased from RMB22,743.1 million in 2024 to RMB24,017.9 million (US$3,434.5 million) in 2025, mainl due to the rise of number of orders resulting from rise in the average monthly number of transacting users and higher monthly order frequency, and new opened frontline fulfillment stations with density and market penetration improved in East China. Additionally, our B2B revenue achieved year-over-year growth, with the revenue contribution from overseas B2B operations continuing to increase and posting rapid sequentially
p. 91 · Read in context →
Item 5. Critical Accounting Policies, Judgments and Estimates — p. 94 · Read the full section →
Gross-basis revenue recognition is why RMB24bn flows through the P&L — it defines Dingdong as a first-party retailer that owns inventory, not a marketplace.
Revenue booked gross because Dingdong is the principal — it fulfills the goods, takes inventory risk, and sets prices.
We recognize product sales made through Dingdong Fresh APP, mini-programs and third-party platforms on a gross basis because we are acting as the principal in these transactions as we (i) are responsible for fulfilling the promise to provide the specified goods, (ii) take on inventory risks and (iii) have discretion in establishing price.
p. 95 · Read in context →
More annual reports
Dingdong (Cayman) Limited — FY2024 Annual Report (Form 20-F) — FY2024 · 201 pages · The pre-divestiture baseline: first full year of GAAP profitability with the China grocery network still fully intact. · Open →
Dingdong (Cayman) Limited — FY2023 Annual Report (Form 20-F) — FY2023 · 192 pages · Shows the “efficiency first” retrenchment year — network pruning and cost discipline on the road to profitability. · Open →
Dingdong (Cayman) Limited — FY2022 Annual Report (Form 20-F) — FY2022 · 178 pages · The strategic-shift year: management reframes from scale-at-all-costs growth to profitability after the Q3 2021 pivot. · Open →
Dingdong (Cayman) Limited — FY2021 Annual Report (Form 20-F) — FY2021 · 352 pages · The first 20-F after the June 2021 NYSE IPO — the original scale-first growth story before the profitability pivot took hold. · Open →
Source: S&P Capital IQ consensus via Xpressfeed · Generated 2026-07-19.
Street snapshot
Three analysts cover the stock and all are constructive — two Buy and one Outperform — for a consensus recommendation score of about 1.33. Their CNY target prices run from 20.69 to 24.19, with a mean of 22.73 and a median of 23.31.
Currency: CNY · Scale: money in millions, absolute (per share) · Analyst counts shown explicitly; recommendation respondents: 3.
| Street view | Reading | Analysts |
|---|---|---|
| Recommendation mix | Buy 2, Outperform 1, Hold 0, Underperform 0, Sell 0 | 3 |
| Consensus score | 1.33 | 3 |
| Target price | mean 22.73; high 24.19; low 20.69 | 3 |
Forward table
Gross margin is held near 29–30% throughout, and coverage thins in the outer years, down to a single estimate for FY2028.
Currency: CNY · Scale: money in millions, absolute (per share) · Analyst count is the estimate count for each period and metric.
| Period | Metric | Mean | YoY | Analysts | Low / high |
|---|---|---|---|---|---|
| FY0E | Revenue | 26,965 | 10.7% | 2 | 25,847 / 28,083 |
| FY0E | EBITDA | 389.0 | 26.4% | 1 | 389.0 / 389.0 |
| FY0E | EBIT | 390.0 | 68.2% | — | — / — |
| FY0E | Net income (GAAP) | 395.0 | 76.2% | 2 | 370.0 / 420.0 |
| FY0E | Net income (normalized) | 492.5 | 39.3% | — | — / — |
| FY0E | EPS (GAAP) | 1.57 | 137.9% | 1 | 1.57 / 1.57 |
| FY0E | EPS (normalized) | 2.19 | 145.5% | 2 | 2.04 / 2.33 |
| FY0E | Gross margin | 29.5% | 1.2% | — | — / — |
| FY0E | Capital expenditure | -40.00 | -19.2% | — | — / — |
| FY0E | ROE | 32.8% | -1.3% | — | — / — |
| FY0E | Cash from operations | 819.0 | 24.8% | — | — / — |
| FY+1E | Revenue | 29,038 | 7.7% | 2 | 27,280 / 30,796 |
| FY+1E | EBITDA | 459.0 | 18.0% | 1 | 459.0 / 459.0 |
| FY+1E | EBIT | 469.5 | 20.4% | — | — / — |
| FY+1E | Net income (GAAP) | 477.0 | 20.8% | 2 | 464.0 / 490.0 |
| FY+1E | Net income (normalized) | 582.5 | 18.3% | — | — / — |
| FY+1E | EPS (GAAP) | 1.96 | 24.8% | 1 | 1.96 / 1.96 |
| FY+1E | EPS (normalized) | 2.58 | 17.8% | 2 | 2.48 / 2.67 |
| FY+1E | Gross margin | 29.4% | -0.3% | — | — / — |
| FY+1E | Capital expenditure | -46.00 | 15.0% | — | — / — |
| FY+1E | Cash from operations | 856.0 | 4.5% | — | — / — |
| FY+1E | ROE | 27.7% | -15.5% | — | — / — |
| FY+2E | Revenue | 28,245 | -2.7% | 1 | 28,245 / 28,245 |
| FY+2E | EBIT | 566.0 | 20.6% | — | — / — |
| FY+2E | Net income (GAAP) | 513.0 | 7.5% | 1 | 513.0 / 513.0 |
| FY+2E | Net income (normalized) | 604.0 | 3.7% | — | — / — |
| FY+2E | EPS (normalized) | 2.79 | 8.3% | 1 | 2.79 / 2.79 |
| FY+2E | Gross margin | 29.6% | 0.7% | — | — / — |
| FY+2E | Capital expenditure | -30.00 | -34.8% | — | — / — |
| FY+2E | Cash from operations | 737.0 | -13.9% | — | — / — |
| Q2 FY2026 | Revenue | 6,902 | 15.5% | 1 | 6,902 / 6,902 |
| Q2 FY2026 | EBIT | 81.00 | 5.2% | — | — / — |
| Q2 FY2026 | Net income (GAAP) | 96.00 | -8.3% | 1 | 96.00 / 96.00 |
| Q2 FY2026 | Net income (normalized) | 123.0 | 2.5% | — | — / — |
| Q2 FY2026 | Gross margin | 29.2% | 0.7% | — | — / — |
| Q3 FY2026 | Revenue | 7,721 | — | 1 | 7,721 / 7,721 |
| Q3 FY2026 | EBIT | 130.0 | — | — | — / — |
| Q3 FY2026 | Net income (GAAP) | 140.0 | 74.3% | 1 | 140.0 / 140.0 |
| Q3 FY2026 | Net income (normalized) | 171.0 | — | — | — / — |
| Q3 FY2026 | Gross margin | 29.4% | — | — | — / — |
| Q4 FY2026 | Revenue | 7,112 | 13.9% | 1 | 7,112 / 7,112 |
| Q4 FY2026 | EBIT | 71.00 | -1.4% | — | — / — |
| Q4 FY2026 | Net income (GAAP) | 87.00 | 180.7% | 1 | 87.00 / 87.00 |
| Q4 FY2026 | Net income (normalized) | 116.0 | 7.4% | — | — / — |
| Q4 FY2026 | Gross margin | 29.4% | 0.7% | — | — / — |
Estimate momentum
Forward consensus has been broadly stable. The moves are small and rest on thin outer-year coverage.
Currency: CNY · Scale: money in millions, absolute (per share) · Point-in-time consensus; analyst count is shown where supplied.
| Period | Metric | Lookback | Then | Now | Direction / magnitude | Analysts |
|---|---|---|---|---|---|---|
| 2027 | Revenue | 30d | 29,038 | 29,038 | flat 0.0% | — |
| 2027 | Revenue | 90d | 29,763 | 29,038 | down 2.4% | — |
| 2027 | Revenue | 180d | 29,387 | 29,038 | down 1.2% | — |
| 2027 | EPS (normalized) | 30d | 2.58 | 2.58 | flat 0.0% | — |
| 2027 | EPS (normalized) | 90d | 2.57 | 2.58 | up 0.1% | — |
| 2027 | EPS (normalized) | 180d | 2.55 | 2.58 | up 0.9% | — |
| 2028 | Revenue | 30d | 28,245 | 28,245 | flat 0.0% | — |
| 2028 | Revenue | 90d | 28,245 | 28,245 | flat 0.0% | — |
| 2028 | EPS (normalized) | 30d | 2.79 | 2.79 | flat 0.0% | — |
| 2028 | EPS (normalized) | 90d | 2.79 | 2.79 | flat 0.0% | — |
Beat / miss record
Normalized-EPS surprise history is thin: the only captured quarter (Q2 2024) shows an 817% beat, but off a near-zero 0.05 consensus that distorts the figure.
Current sequences by metric: Revenue: 2 consecutive misses; EPS (normalized): 1 consecutive beat.
Currency: CNY · Scale: money in millions, absolute (per share) · Consensus is captured before each actual first became effective; analyst count shown per observation.
| Quarter | Metric | Consensus as of | Actual | Surprise | Outcome | Analysts |
|---|---|---|---|---|---|---|
| Q1 FY2026 | Revenue | 6,348 | 5,893 | -7.2% | Miss | — |
| Q4 FY2025 | Revenue | 6,301 | 6,243 | -0.9% | Miss | — |
| Q2 FY2025 | Revenue | 5,971 | 5,976 | 0.1% | Beat | — |
| Q1 FY2025 | Revenue | 5,470 | 5,479 | 0.2% | Beat | — |
| Q4 FY2024 | Revenue | 5,892 | 5,905 | 0.2% | Beat | — |
| Q3 FY2024 | Revenue | 6,508 | 6,538 | 0.5% | Beat | — |
| Q2 FY2024 | Revenue | 5,425 | 5,599 | 3.2% | Beat | — |
| Q2 FY2024 | EPS (normalized) | 0.05 | 0.46 | 817.2% | Beat | — |
| Q1 FY2024 | Revenue | 4,872 | 5,024 | 3.1% | Beat | — |
Where the street disagrees
Disagreement is widest on EBITDA and outer-year revenue. Near-term revenue, by contrast, is tightly clustered (stddev ~94m on a ~24,288m mean), so the small estimate counts limit how much to read into the wider spreads.
Currency: CNY · Scale: money in millions, absolute (per share) · Dispersion is high-low divided by absolute mean; analyst count shown per item.
| Period | Metric | Mean | Low | High | Spread / mean | Analysts |
|---|---|---|---|---|---|---|
| 2025 | EBITDA | 356.3 | 311.4 | 445.5 | 37.6% | 3 |
| 2026 | EPS (normalized) | 2.19 | 2.04 | 2.33 | 13.3% | 2 |
| 2026 | Net income (GAAP) | 395.0 | 370.0 | 420.0 | 12.7% | 2 |
| 2027 | Revenue | 29,038 | 27,280 | 30,796 | 12.1% | 2 |
| 2025 | Net income (GAAP) | 268.6 | 253.0 | 280.0 | 10.1% | 4 |
Source: Visible Alpha consensus via S&P Xpressfeed · Consensus as of 2026-06-25 · generated 2026-07-19.
Model trust
With only one contributor this cannot be read as broad consensus, and the freshest line-item revision is November 2025 while the core P&L and KPI lines were last touched in August 2025, both stale against this July 2026 snapshot. Treat it as a single-analyst view rather than the market's.
Base currency: CNY · VA scales normalized from Abs, M; item currencies and units retained · Coverage depth and vintage; broker count is the maximum represented.
| Brokers | Line items | Last revision |
|---|---|---|
| 1 | 329 | 2026-06-25 |
Caution: Coverage is thin at 1 broker.
Operating KPIs
The most decision-useful company-specific drivers with full forward coverage are GMV, total orders, average order value and the fulfillment-station count. Monthly-active-user coverage stops after FY-2026, so the user base is only partly modeled.
Base currency: CNY · VA scales normalized from Abs, M; item currencies and units retained · FY-1A / FY0E / FY+1E; broker count shown per KPI.
| Operating KPI | Source | FY-1A | FY0E | FY+1E | Brokers |
|---|---|---|---|---|---|
| (Increase)/decrease in inventories | CD | -270,918.87bn Amount | -213,831.34bn Amount | -446.47bn Amount | 1 |
| (Increase)/decrease in receivables | CD | 17,074.74bn Amount | 16,302.88bn Amount | 13,242.04bn Amount | 1 |
| (Increase)/decrease in working capital | CD | -471,388.24bn Amount | 500,313.64bn Amount | -587,103.91bn Amount | 1 |
| Accounts payable | CD | 1,529,640.10bn Amount | 2,053,313.78bn Amount | 1,539,409.11bn Amount | 1 |
| Amounts due to related parties - Current | CD | 506,844.06bn Amount | 556,954.16bn Amount | 539,789.18bn Amount | 1 |
| Assets - Noncurrent | CD | 1,774,373.50bn Amount | 1,848,371.00bn Amount | 1,838,868.50bn Amount | 1 |
| Average order value - Non S5 - Product(CNY) | CD | 113.0 Amount | 113.0 Amount | 113.0 Amount | 1 |
| Average order value - S5 - Product(CNY) | CD | 70.00 Amount | 70.00 Amount | 70.00 Amount | 1 |
| Average order value(CNY) | CD | 69.30 Amount | 70.42 Amount | 70.53 Amount | 1 |
| Capital additions | CD | 106,076.01bn Amount | 112,730.50bn Amount | 120,744.41bn Amount | 1 |
| Cash and cash equivalents-Beginning balance | CD | 890,215.00bn Amount | 1,703,279.45bn Amount | 3,623,442.53bn Amount | 1 |
| Cash and cash equivalents-Ending balance | CD | 1,703,279.45bn Amount | 3,623,442.53bn Amount | 4,588,260.10bn Amount | 1 |
P&L bridge
Base currency: CNY · VA scales normalized from Abs, M; item currencies and units retained · Margins are derived against revenue; YoY compares adjacent fiscal columns; broker count shown per line.
| P&L line | FY-1A | FY0E | FY+1E | Brokers |
|---|---|---|---|---|
| Revenue | 24,922,345.78bn Amount | 26,485,805.55bn Amount (6.3% YoY) | 28,368,656.55bn Amount (7.1% YoY) | 1 |
| Gross Profit | 7,286,895.82bn Amount (29.2% margin) | 7,736,090.82bn Amount (29.2% margin; 6.2% YoY) | 8,283,941.22bn Amount (29.2% margin; 7.1% YoY) | 1 |
| Ebitda | 1,251,570.71bn Amount (5.0% margin) | 1,437,277.93bn Amount (5.4% margin; 14.8% YoY) | 1,517,363.89bn Amount (5.3% margin; 5.6% YoY) | 1 |
| Operating Income | 352,982.34bn Amount (1.4% margin) | 482,318.19bn Amount (1.8% margin; 36.6% YoY) | 494,516.96bn Amount (1.7% margin; 2.5% YoY) | 1 |
| Net Income | 401,622.34bn Amount (1.6% margin) | 495,288.19bn Amount (1.9% margin; 23.3% YoY) | 567,486.96bn Amount (2.0% margin; 14.6% YoY) | 1 |
| Eps | 1.80 Amount | 2.22 Amount (23.3% YoY) | 2.54 Amount (14.6% YoY) | 1 |
Consensus dispersion
Every item carries a single contributor, so minimum, maximum and quartiles collapse onto the mean and standard deviation is zero. There is effectively no consensus dispersion to read here; the flat spreads reflect the absence of a second estimate, not genuine analyst agreement.
Base currency: CNY · VA scales normalized from Abs, M; item currencies and units retained · Top high-low spreads relative to absolute mean; requires at least 3 brokers.
| Line item | Period | Mean | Min | Q1 | Q3 | Max | Spread / mean | Brokers |
|---|---|---|---|---|---|---|---|---|
| No qualifying dispersion | — | — | — | — | — | — | — | — |
Quarterly path
Year-over-year revenue growth stays in the mid-single digits; resting on one August-2025 model, the pattern reads as seasonal rather than a genuine inflection.
Base currency: CNY · VA scales normalized from Abs, M; item currencies and units retained · Next four supplied quarters; final column is maximum broker coverage in the row.
| Quarter | (Increase)/decrease in inventories | (Increase)/decrease in receivables | (Increase)/decrease in working capital | Accounts payable | Amounts due to related parties - Current | Total revenue | EPS Diluted, Applicable to common stockholders(CNY) | Broker coverage |
|---|---|---|---|---|---|---|---|---|
| 3QFY-2026 | — | — | — | — | — | 7,088,974.57bn Amount | 0.73 Amount | 1 |
| 4QFY-2026 | — | — | — | — | — | 6,973,876.85bn Amount | 0.72 Amount | 1 |
| 1QFY-2027 | — | — | — | — | — | 6,166,624.62bn Amount | 0.41 Amount | 1 |
| 2QFY-2027 | — | — | — | — | — | 7,049,012.58bn Amount | 0.67 Amount | 1 |
435 stale period values omitted; 8 line items fully removed.
Source: S&P Capital IQ transcripts via Xpressfeed · latest indexed call 2025-11-12 · generated 2026-07-19.
Latest call digest
Dingdong (Cayman) Limited, Q3 2025 Earnings Call, Nov 12, 2025 · 2025-11-12T12:00:00
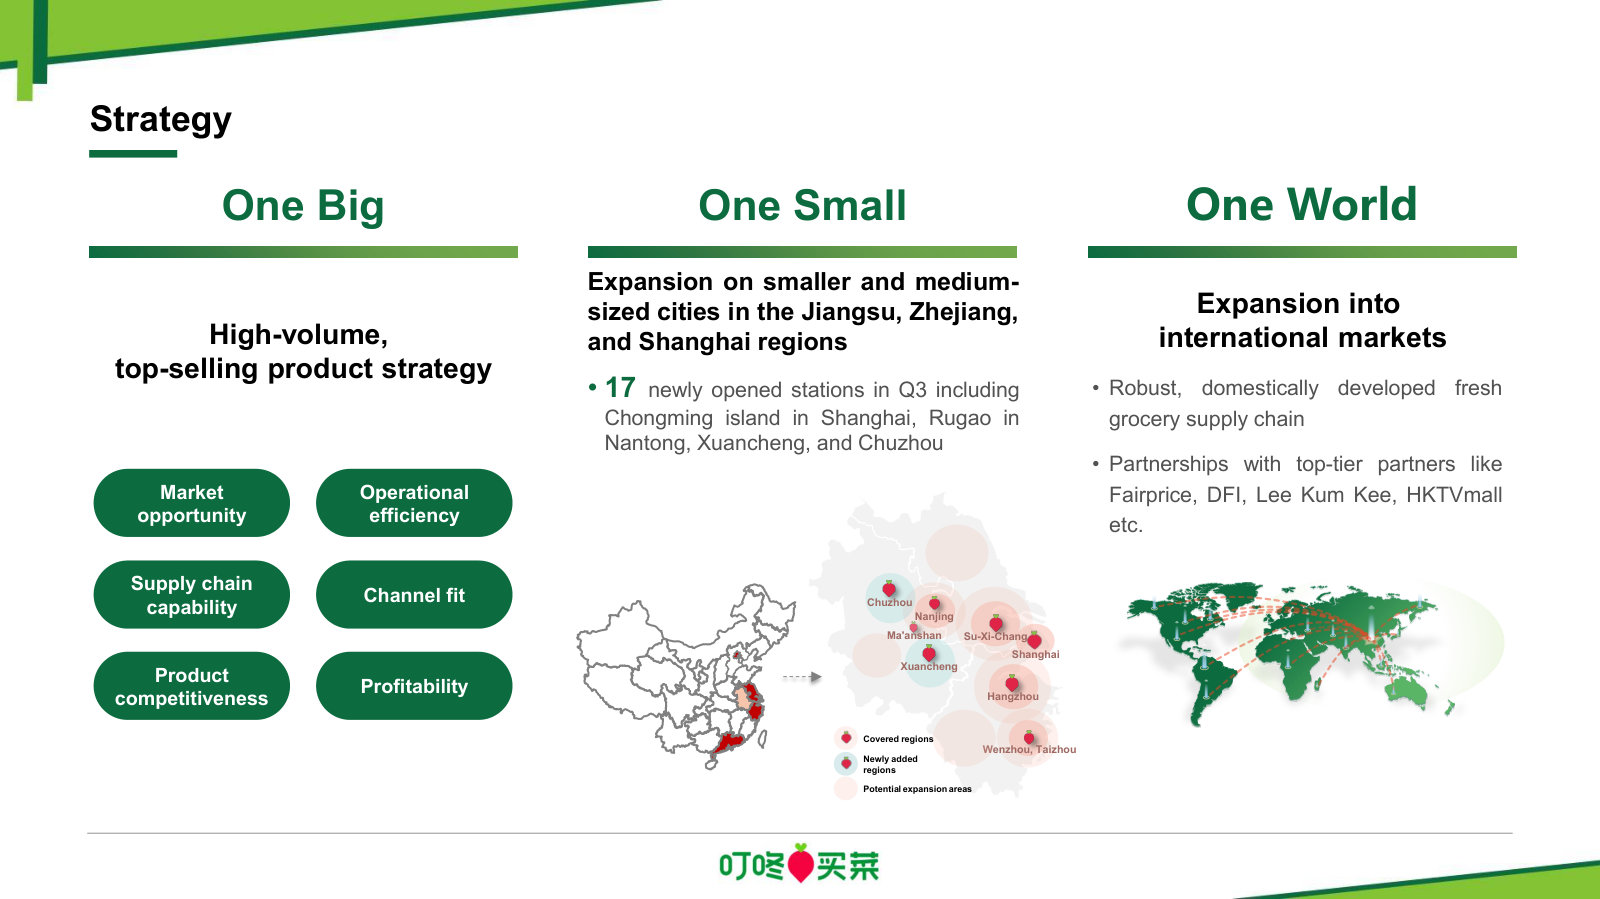
Q3 2025 (reported Nov 12, 2025). The prepared remarks led with record absolutes: GMV of RMB 7.27 billion and revenue of RMB 6.66 billion, described as Dingdong's highest ever, alongside a 12th straight quarter of non-GAAP profitability and a 7th of GAAP profitability. But the growth underneath is now essentially flat — GMV up 0.1% and revenue up 1.9% year-over-year — a sharp step down from the ~27% revenue growth reported a year earlier in Q3 2024. Management used the call to unveil a new "One Big, One Small, One World" framework (high-volume top-selling products; frontline stations in small cities; international expansion) layered on top of the existing 4G strategy. Profitability also compressed: non-GAAP net margin was 1.5% (vs. a 2.5% Q3 2024 peak) and gross margin 28.9%, down 0.9 percentage points. The Q&A reality was thin and did not test the deceleration: Jefferies' line was initially muted, and only two questions landed — CICC on the competitive landscape and Jefferies on the top-selling product strategy — both of which management answered on its own terms, reiterating a differentiation-over-price-war posture. The Q4 outlook was the softest in the recent history reviewed: management guided only to maintaining last year's scale (i.e., flat) and non-GAAP profitability.
Participant coverage from the latest call.
| Group | Participants | Count |
|---|---|---|
| Management | Operator; Nicky Zheng — Director of Investor Relations, Dingdong (Cayman) Limited; Liang Changlin — Founder & Chairman, Dingdong (Cayman) Limited; Song Wang — CEO & Director, Dingdong (Cayman) Limited | 4 |
| Analysts | Yang Bai — Analyst, China International Capital Corporation Limited, Research Division; Unknown Analyst | 2 |
Curated latest-call exchanges; one row per analyst topic.
| Analyst | Firm | Topic | What changed in Q&A |
|---|---|---|---|
| Yang Bai | China International Capital Corporation Limited, Research Division | Competitive landscape in instant retail / fresh groceries | Asked how Dingdong views intensifying competition from Alibaba and Meituan and what opportunities it creates; Liang reframed to long-term differentiation and supply-chain depth rather than price competition, and did not quantify any share impact. |
| Erica Chua | Jefferies LLC, Research Division | Top-selling product strategy and summer campaign | After an initial muted line, asked management to elaborate on the top-selling product strategy tied to the Q3 summer campaign; Liang cited specific blockbuster SKUs and the shift from a channel-distributor to a product-manager mindset. |
Theme tracker
Themes are curator-classified across supplied calls.
| Theme | Status | Quarters mentioned | Read-through |
|---|---|---|---|
| Competition and price wars in instant retail | persisted | Q4 2022, Q1 2023, Q3 2023, Q2 2024, Q2 2025, Q3 2025 | Analysts have raised the competitive landscape almost every year; management's answer is consistent — decline to name or quantify rivals and pivot to its 'narrow and deep' differentiation. By Q3 2025 the tone shifted to openly acknowledging that competition is intensifying. |
| 4G strategy (good users, products, services, mind share) | emerged | Q4 2024, Q1 2025, Q2 2025, Q3 2025 | Framed as 'better' in Q4 2024 and formally launched in Q1 2025; now the organizing narrative of every call. Management ties it to the quality pivot that has compressed near-term growth and margins. |
| International / overseas expansion | emerged | Q2 2024, Q1 2025, Q2 2025, Q3 2025 | Grew from a brief mention in 2024 to a named pillar ('One World') by Q3 2025, anchored on supply-chain export partnerships (DFI, FairPrice, Lee Kum Kee) rather than replicating the domestic station model abroad. |
| Full-chain AI integration | emerged | Q2 2025, Q3 2025 | Introduced as a dedicated segment of prepared remarks in Q2 2025 (supply-chain intelligence, LLM agents, consumer app features) and referenced again in Q3 2025; still a new and thinly evidenced theme. |
| Pandemic / high-base year-over-year effects | dropped | Q4 2022, Q1 2023, Q2 2023, Q3 2023, Q4 2023, Q1 2024 | Dominated commentary through 2023 as the explanation for declining year-over-year revenue; fully absent from 2025 calls once comparisons normalized. Its disappearance marks the transition out of the post-COVID base distortion. |
| Supply-chain depth, self-operated factories and Guyu / private label | persisted | Q4 2022, Q4 2023, Q3 2024, Q4 2024, Q1 2025, Q2 2025, Q3 2025 | The most durable strategic thread — direct sourcing, in-house factories and the Guyu food group are presented as the moat in every call, and are the single most-questioned topic in Q&A. |
| Frontline fulfillment station expansion | persisted | Q2 2024, Q3 2024, Q4 2024, Q1 2025, Q3 2025 | Station-opening targets were a 2024 growth driver (80, raised to 110, ended at 130). In 2025 the emphasis shifted to smaller-city stations (40 opened year-to-date, 17 in Q3 2025), reflecting the search for new penetration as core-region growth slows. |
Guidance ledger
Quotes, calls, and speakers are source-verified; outcomes are curator-classified.
| Verbatim guidance | Call | Speaker | Curator outcome | Outcome note |
|---|---|---|---|---|
| “we are increasing our target for new fulfillment stations openings in 2024 to approximately 110.” | Dingdong (Cayman) Limited, Q3 2024 Earnings Call, Nov 06, 2024 · 2024-11-06T12:00:00 | Liang Changlin | kept | The Q4 2024 call reported 130 new frontline fulfillment stations opened during the year, surpassing the raised 110 target. |
| “we aim to achieve an annual revenue scale of RMB 100 billion.” | Dingdong (Cayman) Limited, Q2 2024 Earnings Call, Aug 07, 2024 · 2024-08-07T12:00:00 | Liang Changlin | pending | A long-term ambition framed over the next seven years (a '1 to 10' stage); FY2024 revenue was RMB 23.07 billion and growth has since decelerated, so the target remains far out and unproven in the available history. |
| “We expect to achieve year-over-year scale growth and maintain non-GAAP profitability in the first quarter of 2025.” | Dingdong (Cayman) Limited, Q4 2024 Earnings Call, Mar 06, 2025 · 2025-03-06T12:00:00 | Liang Changlin | kept | Q1 2025 revenue rose 9.1% year-over-year with non-GAAP net profit of RMB 30 million. |
| “We anticipate maintaining year-on-year growth in scale and achieving non-GAAP profitability for the second quarter of 2025.” | Dingdong (Cayman) Limited, Q1 2025 Earnings Call, May 16, 2025 · 2025-05-16T12:00:00 | Liang Changlin | kept | Q2 2025 revenue rose 6.7% year-over-year with non-GAAP net profit of RMB 130 million. |
| “We expect significant growth in both performance scale and profit margin by then.” | Dingdong (Cayman) Limited, Q1 2025 Earnings Call, May 16, 2025 · 2025-05-16T12:00:00 | Liang Changlin | pending | Refers to the end of 2025. On the available history, Q3 2025 revenue growth had slowed to 1.9% and Q4 was guided only to flat scale, so a significant second-half step-up in scale and margin is not yet evident. |
| “we still aim for a stable scale year-over-year and maintain non-GAAP profitability.” | Dingdong (Cayman) Limited, Q2 2025 Earnings Call, Aug 21, 2025 · 2025-08-21T12:00:00 | Liang Changlin | kept | Q3 2025 GMV was roughly flat (+0.1%), revenue rose 1.9%, and non-GAAP profitability was maintained (12th consecutive quarter). |
| “We anticipate that export revenues this year will reach RMB 600 million and expect that by 2027, exports will account for more than 50% of Guyu's revenues.” | Dingdong (Cayman) Limited, Q1 2025 Earnings Call, May 16, 2025 · 2025-05-16T12:00:00 | Song Wang | pending | Both the full-year 2025 export figure and the 2027 mix target fall outside the available call history and cannot be verified here. |
| “maintaining last year's scale and non-GAAP profitability in Q4.” | Dingdong (Cayman) Limited, Q3 2025 Earnings Call, Nov 12, 2025 · 2025-11-12T12:00:00 | Liang Changlin | pending | Q4 2025 results are not yet in the call history; this guides only to flat year-over-year scale. |
Q&A pressure map
Question counts and firms are curator tallies; analyst coverage shown above.
| Topic | Questions | Firms | Pressure / response |
|---|---|---|---|
| Product development, private label and self-operated factories (Guyu) | 8 | Jefferies LLC, Research Division, China International Capital Corporation Limited, Research Division, Daiwa Securities Co. Ltd., Research Division, Crédit Suisse AG, Research Division | The single most recurring Q&A theme across the twelve calls. Management engages fully, answering with detailed product examples (Black Diamond pork, Guyu food group, summer top-sellers) rather than deflecting. |
| Competitive landscape | 6 | Jefferies LLC, Research Division, China International Capital Corporation Limited, Research Division, Daiwa Securities Co. Ltd., Research Division | Pressed repeatedly since 2023. Management consistently declines to name or size specific rivals or their impact on Dingdong, redirecting to its own differentiation — a soft, if consistent, deflection. |
| Cash flow, short-term borrowings and balance sheet | 4 | China International Capital Corporation Limited, Research Division, CMS | Concentrated in 2023-2024 as profitability and cash turned positive. The CFO answers these directly with specific figures on operating cash flow, net debt and self-owned funds; no evasion evident. |
| 4G strategy execution | 2 | Jefferies LLC, Research Division | A newer line of questioning in 2025 as the quality pivot began weighing on growth; management frames it as a deliberate, transitional inside-out transformation. |
Language shifts
Only language evidence verified against the referenced component is shown.
| Observation | Verbatim evidence | Call ID | Component |
|---|---|---|---|
| Peak confidence in the 2024 calls — management layered a forward-looking superlative onto already strong guidance, the high-water mark of tone in this history. | “We have full confidence in the growth of scale and profits this year and we are even more confident about the future.” | 1887550005 | 2 |
| First explicit hedge that the strategy shift could hurt near-term results, introduced in Q4 2024 after a year of uniformly upbeat outlooks — a new note of caution. | “we're also in the process of transitioning from pursuing short-term scale and profitability, so focusing on quality and long-term competitiveness, which may impact us.” | 1933226862 | 2 |
| Guidance language stepped down from 'growth' to merely 'stable scale' by Q2 2025, an explicit lowering of the near-term growth bar versus the 2024 confidence. | “we still aim for a stable scale year-over-year and maintain non-GAAP profitability.” | 1957230433 | 2 |
| By Q3 2025 management openly characterized competition as intensifying — more pointed than the earlier detached 'we rarely evaluate our peers' framing. | “Industry-wide competition in the instant retail sector is intensifying with both platforms and off-line merchants increasing their investments to gain market share.” | 1969787743 | 2 |
The twelve-call arc is coherent: a hard-won 2023 turn to profitability, a high-growth 2024, and a 2025 in which the 4G quality pivot has preserved the profit streak and cash generation but flattened growth to roughly zero and compressed margins from their 2024 peak. The debate the calls sharpen is whether 'narrow and deep' differentiation can reaccelerate scale as instant-retail competition intensifies, or whether flat top-line with steady low-single-digit margins is the new steady state.
Fresh Grocery, Net Cash
Dingdong is a self-operated fresh-grocery delivery company in China that IPO'd on the NYSE in June 2021 at US$23.50 per ADS, burned through more than ¥13 billion becoming a scale player, and then retrenched. It now posts modest GAAP profits and positive free cash flow on ¥24.4 billion of revenue, and holds ¥3.98 billion (about US$569 million) of cash and short-term investments — close to its entire market value. This report examines whether that combination is a margin of safety or a value trap.
Dingdong reports its financials in Chinese renminbi (¥); its shares trade in US dollars (US$) on the NYSE as American Depositary Shares (ADSs). Figures below are in ¥ unless marked US$. US$ equivalents shown in parentheses are the company's own conversions from its filings (roughly ¥7.0 per US$1).
What the company does
Dingdong runs an on-demand grocery platform built on a grid of company-operated frontline fulfillment stations — micro-warehouses placed inside dense neighborhoods that stock fresh food and dispatch it to a customer's door, typically within about half an hour. It is not a marketplace: the company sources, stocks, prices, and delivers the goods itself, selling vegetables, meat, seafood, fruit, eggs, and prepared food. At the time of its IPO it operated more than 950 such stations across 29 cities [1].
The model is capital-light in equipment but operationally heavy: gross margins run near 30%, and the business earns its keep by converting orders densely enough that delivery and station costs stay below that gross margin. Average order value was ¥70.1 in 2025 [2]; gross merchandise value (GMV) reached ¥26.4 billion (US$3.78 billion) [3]. After its retrenchment, the footprint is concentrated in the Yangtze River Delta — Jiangsu, Zhejiang, and Shanghai — where the company added 61 net new stations and entered three new cities in 2025 [4].
FY2025 Revenue (¥bn)
FY2025 Net Income (¥m)
FY2025 Free Cash Flow (¥m)
Cash and Investments (¥bn)
Sources: FY2025 revenue, net income, GMV — FY2025 Annual Report, Operating and Financial Review [5]; cash and short-term investments [6]; free cash flow derived from reported operating cash flow of ¥535.5m less capex of ¥177.8m [7].
From blitzscale to profit
Dingdong's history divides cleanly at the third quarter of 2021, when management shifted its strategy to "efficiency first, with due consideration of scale" [8]. Before that pivot, the company grew revenue from ¥11.3 billion in 2020 [9] to ¥24.2 billion in 2022 while losing enormous sums — a ¥6.4 billion net loss in 2021 alone [10], equal to a 32% net loss margin [11]. Those years built the platform and left an accumulated deficit of roughly ¥13 billion still sitting on the balance sheet today.
The retrenchment was deliberate. In 2022 and 2023 the company withdrew from cities with immaterial GMV that required heavy investment to scale [12], and revenue fell 17.5% to ¥20.0 billion in 2023. That was the cost of the turn: it produced the first full year of non-GAAP profit in 2023, the first GAAP profits in 2024 and 2025, and a return to top-line growth.
Source: 2023–2025 figures per FY2025 Annual Report, Operating and Financial Review [13]; 2021–2023 figures per FY2023 Annual Report [14]; 2020–2022 figures per FY2022 Annual Report [15].
The profit inflection is the more important chart. Net losses of ¥6.4 billion (2021) and ¥806.9 million (2022) narrowed to ¥91.3 million in 2023, then flipped to net income of ¥304.4 million in 2024 and ¥231.7 million (US$33.1 million) in 2025 [16] — net margins of 1.3% and 1.0% [17]. By its own account the company has now delivered GAAP profits for eight straight quarters and positive year-over-year revenue growth for eight straight quarters [18].
Source: FY2022, FY2023, and FY2025 Annual Reports, Financial Highlights [19] [20] [21].
Two features of the profit deserve to be held in view rather than celebrated. The margin is thin — a 1.0% net margin means a small move in gross margin or fulfillment cost swings the whole result — and growth has decelerated sharply, from a 46% revenue CAGR through 2022 to 5.6% in 2025 [22], partly because falling consumer prices for staples like pork and vegetables weighed on revenue. This is a business that has stabilized, not one visibly compounding.
The Balance Sheet
What makes Dingdong unusual is not its income statement but its capitalization. At the end of 2025 the company held ¥3.98 billion (US$568.7 million) in cash, restricted cash, and short-term investments [23], against ¥0.87 billion (US$124.6 million) of short-term borrowings that management has been actively reducing [24]. That leaves net cash near ¥3.1 billion (about US$444 million) — a figure the company itself computes by netting short-term borrowings against its cash, restricted cash, short-term investments, and long-term deposits [25].
The market's own valuation sits against that. With roughly 354 million ordinary shares outstanding [26] — each ADS represents 1.5 ordinary shares [27] — a recent ADS price near US$2.58 (April 2026, a market value rather than a figure from the filings) implies a market value of about US$609 million. At that price the ~US$609 million market value sits modestly above the ¥3.98 billion (US$568.7 million) of cash and investments; only at the lower prices the stock has traded through does the equity change hands at or below that cash. The equity trades in the vicinity of its net cash either way, and the business itself — ¥24 billion of revenue, positive free cash flow — is being ascribed an enterprise value of only a few hundred million renminbi.
Source: cash and short-term investments (¥3.98bn, US$568.7m) per FY2025 Annual Report [28]; market value derived from ~354m ordinary shares [29] and a recent ADS price near US$2.58 (April 2026), consensus data feed.
This is the setup a value or special-situation investor is drawn to, and it is worth stating both what it offers and what it does not. It offers genuine downside support: a company generating cash and holding more cash than its market value is hard to zero out, which speaks directly to bankruptcy risk. It does not, by itself, offer a return. The cash has been static-to-declining — the pile fell from ¥5.31 billion in 2023 to ¥3.98 billion in 2025 as the company repaid borrowings [30] — the company pays no dividend, and a controlled company can hold cash indefinitely without returning it. The comparison is also sensitive to the share price, which has been volatile; the two analysts covering the stock carry a mean target near US$3.35, at which the market value would exceed the cash.
Who controls it, and who backed it
Dingdong is a founder-controlled company. Changlin Liang, the founder, chairman, and CEO, beneficially owned about 25.2% of the share capital but 80.9% of the voting power at the end of 2025, through Class B shares that carry 20 votes each against one vote for the Class A shares that trade as ADSs [31]. The company is a "controlled company" under NYSE rules and is exempt from the requirement that a majority of its board be independent [32]. For an investor who prizes founder skin in the game, the alignment is real; the same structure also means minority holders have little formal say and cannot force a sale or a payout.
The register of prior backers is the other half of the story. The IPO — which raised only about US$95.7 million, three-quarters of it taken up by affiliates of existing shareholders [33] — priced this as a marquee growth name. Its cap table still lists General Atlantic (5.5%), a SoftBank Vision Fund vehicle (5.9%), and Sequoia China / HongShan (4.7%), alongside Liang's holding companies [34]. A stock once owned by those names, down roughly 90% from its IPO price and covered by two analysts, is exactly the kind of once-loved, now-ignored situation where mispricing can persist.
What forward estimates imply
The thin analyst coverage — two estimates — expects the profit trend to continue and steepen: consensus revenue of ¥27.0 billion for 2026 (up about 11%) and ¥29.0 billion for 2027, with earnings expected to roughly double off the 2025 base [35]. Those are the numbers a bull leans on and a skeptic should stress-test; the forward financials, insider economics, and industry backdrop each warrant their own fuller treatment later in this report.
The question this report addresses
Dingdong is a fallen grocery-delivery star with a rare shape: restored profitability, positive free cash flow, and a net-cash balance sheet worth close to its whole market value, wrapped inside a founder-controlled Chinese ADR in a fiercely competitive market. The question the following chapters work through is whether that restored profitability is durable enough — and the balance sheet protective enough — to make a stock trading near its own cash a genuine margin-of-safety opportunity, or whether thin margins, decelerating growth, China's instant-retail price war, and the governance and delisting overhang leave it a value trap in which the cash is real but the return never arrives.
The Financial Record
Three audited years show a genuine but fragile turnaround. Revenue recovered from a 2023 retrenchment to a record RMB24,359.9 million in 2025, and Dingdong reached GAAP profit for the first time [1]. But the net margin is about 1%, gross margin is drifting down, and almost all of the reported profit comes from government subsidies and interest on the cash pile rather than from selling groceries [2]. Consensus rests on two analysts — and a pending sale to Meituan changes what these numbers mean.
The revenue arc: retrenchment, then a decelerating recovery
Dingdong's top line is not a smooth growth story. After the 2021 strategic pivot to "efficiency first with due consideration of scale," the company exited cities and cut back, and revenue fell 17.5% in 2023 to RMB19,971.2 million. It then recovered to RMB23,066.3 million in 2024 (+15.5%) and edged to a record RMB24,359.9 million in 2025, but growth had decelerated to 5.6% [3].
Source: FY2025 Annual Report (Form 20-F), Operating Results — 2023–2025 figures [4]; 2022 from the FY2024 Annual Report income statement [5].
The recovery is real but shallow, and the mix underneath it is softening. Average order value slipped from RMB72.1 in 2023 to RMB71.4 in 2024 and RMB70.1 in 2025, which management attributes to "declining consumer prices for certain commodities" [6]. In other words, order counts are carrying growth while price per basket falls — the footprint of deflation and competition in China's grocery market, not pricing power.
Where the profit actually comes from
The three-year record establishes where the profit actually comes from. In 2025, total revenues of RMB24,359.9 million minus total operating costs and expenses of RMB24,373.2 million left the core grocery operation at a loss of roughly RMB13 million — before any other income [7]. The reported RMB131.7 million of operating income exists because of "other operating income, net" of RMB145.0 million — which the company says rose mainly on RMB26.4 million more in government subsidies [8]. Government subsidies alone were RMB87.4 million in 2025, up from RMB61.0 million in 2024 and RMB18.1 million in 2023 [9].
Below the operating line, RMB125.6 million of interest income — earned on the cash and short-term investments — net of RMB16.8 million interest expense, lifted pre-tax income to RMB240.9 million [10]. Split the profit into its three drivers across the three years and the pattern is clear: the grocery operation hovers around breakeven, while subsidies and interest on the balance sheet do the work.
Source: derived from the FY2025 income statement — core operations = total revenues less total operating costs; other operating income, net; interest income less interest expense [11].
Read down the FY2025 column and the arithmetic is stark: of RMB231.7 million net income, RMB145.0 million came from other operating income (chiefly subsidies) and about RMB109 million from net interest, against a small operating loss on the core business and RMB9.2 million of tax [12]. The strongest fact on the other side is that this is not accounting sleight of hand: the subsidies have recurred and grown for three straight years, and fulfillment efficiency is genuinely improving (below), so the core operation is at breakeven rather than deeply loss-making — a real achievement for a model that lost RMB6.4 billion in 2021. But two of the three profit engines are policy-dependent and balance-sheet-dependent, and the interest engine is shrinking on its own: interest income fell 18.7% in 2025 as the company drew down cash and repaid borrowings [13]. What would change this read is the core line turning durably positive — revenue growing faster than the cost base rather than the two moving in lockstep. The quarter-by-quarter path of that core line — its crest and the reversal that followed — is traced in Margin Trajectory.
Margin structure: compression offset by fulfillment leverage
The cost stack explains why the core barely breaks even. Cost of goods sold has risen as a share of revenue every year — 69.3% in 2023, 69.9% in 2024, 70.8% in 2025 — so gross margin has compressed from 30.7% to 29.2% [14]. Working against that, fulfillment expense — the delivery riders, station leases and couriers that make 30-minute grocery possible — has fallen from 23.5% to 21.9% of revenue as order density improved [15]. The net of falling gross margin and improving fulfillment leverage is an operation that lands, three years running, within a percentage point of breakeven.
Source: FY2025 Annual Report (Form 20-F), operating costs and expenses as a percentage of revenues [16].
Add-backs are modest and honest. The only reconciling item between GAAP and non-GAAP profit is share-based compensation, which fell to RMB78.4 million in 2025; on that basis non-GAAP net income was RMB310.1 million (1.3% margin), down from RMB422.9 million in 2024 [17]. Non-GAAP profitability fell year-over-year just as GAAP profit did — the adjustments do not paper over a decline.
Cash conversion: strong, but flattered by working capital
On cash, the record looks better than the income statement — with a caveat. Operating cash flow swung from RMB(234.6) million in 2023 to RMB929.0 million in 2024, then RMB535.5 million in 2025 — comfortably above net income in both profitable years [18]. Capital intensity is low — capex was RMB177.8 million in 2025, about 0.7% of revenue, since the fulfillment stations are leased rather than owned — leaving free cash flow of roughly RMB358 million [19].
Source: FY2025 Annual Report (Form 20-F), Consolidated Statements of Cash Flows; free cash flow = operating cash flow less capital expenditure [20].
The caveat is what drives the cash. In 2025, accounts payable grew by RMB259.9 million — a working-capital inflow — and the mechanics of lease accounting add back RMB717.5 million of non-cash lease expense against RMB691.0 million of lease payments [21]. This is a supplier-financed model: it converts thin profit into real cash while payables keep expanding, but that tailwind is finite and both operating and free cash flow already fell by more than a third in 2025. The cash conversion is genuine; it is not a growth engine.
The balance sheet: the strongest part of the story
The turnaround has rebuilt a fortress balance sheet, which is where the investment case in Fresh Grocery, Net Cash begins. At end-2025 the company held RMB1,106.8 million of cash, RMB0.3 million of restricted cash and RMB2,869.7 million of short-term investments — RMB3,976.8 million (US$568.7 million) in all — against short-term borrowings of RMB871.5 million, for net cash near RMB3,105 million [22] [23].
Net Cash (RMB m)
Shareholders' Equity (RMB m)
Accumulated Deficit (RMB m)
Source: FY2025 Annual Report (Form 20-F), Consolidated Balance Sheets and Statements of Changes in Shareholders' Equity [24] [25].
Two footnotes temper the fortress. First, RMB429.1 million of the short-term deposits is pledged as collateral for borrowings, so not every yuan of the reported cash is freely deployable [26]. Second, shareholders' equity of RMB1,040.8 million sits on top of an accumulated deficit of RMB13,163.2 million — the record of the blitzscale losses that a decade of paid-in capital funded [27]. Capital return has so far been token: the company repurchased just RMB8.8 million of stock in 2025 and has never paid a dividend [28].
Forward estimates: a thin consensus looking the wrong way
The published forward view is sparse and should be weighted accordingly: two analysts cover the revenue line and expect the recovery to reaccelerate — to roughly RMB26,965 million in 2026 (+10.7%) and RMB29,038 million in 2027 (+7.7%), with earnings revisions running one up and none down over the past 30 days.
Source: FY2025 actuals per the FY2025 Annual Report [29]; 2026–2027 are consensus estimates from two analysts, as reported.
Two things blunt the usefulness of these numbers. The coverage is too thin to triangulate — a single revision moves the "consensus" — and, more fundamentally, the estimates describe the standalone grocery business as if it will keep running. It will not in its current form. On February 5, 2026, Dingdong signed a definitive agreement to sell that business.
What the numbers now describe: a business being sold
Everything above is the audited record of a company that has agreed to dispose of substantially all of it. Under a share purchase agreement dated February 5, 2026, Dingdong will sell Dingdong Fresh BVI — which holds substantially all of its China operations — to Two Hearts Investments Limited, a wholly-owned subsidiary of Meituan (HKEX: 3690), for cash consideration of US$717 million, plus the right to draw up to US$280 million more in cash from the business before closing, for expected total proceeds of up to US$997 million [30]. That figure alone is nearly twice the company's entire market value discussed in Fresh Grocery, Net Cash. Ninety percent is payable at closing, ten percent after tax settlement, and the deal is conditional on anti-monopoly clearance from China's SAMR and had not closed as of the latest filings [31]. On February 10, 2026, the company said it intends to use a substantial majority of the proceeds for share repurchases and/or dividends upon closing [32].
Two consequences follow for anyone reading the trailing numbers. The China business is now reported as discontinued operations and its assets as held-for-sale, which means depreciation and amortization on those assets has stopped — a change that inflated reported net income by roughly RMB138 million in the first quarter of 2026 alone, and will keep flattering quarterly profit until the deal completes [33]. And the forward estimates above describe an entity the company is exiting; what remains at Dingdong (Cayman) after closing is the sale proceeds, a fast-growing but loss-making overseas business — up 195% year-over-year but still losing RMB71.4 million in the first quarter of 2026 — and a stated plan to return most of the cash [34]. The three-year record measures the earning power of what Meituan is buying; it is a weak proxy for what an investor in the ADS now owns.
The Meituan Sale
On February 5, 2026 Dingdong agreed to sell its entire China business to a Meituan subsidiary for US$717 million, plus up to US$280 million of cash it can draw out of the business first — up to US$997 million in all, against a market value of roughly US$600 million. Management then said it intends to hand a substantial majority of the proceeds back to shareholders. That turns the balance-sheet cash from a matter of trust into a dated, conditional transaction.
Dingdong reports in Chinese renminbi (¥); its ADSs trade in US dollars on the NYSE (two ADSs represent three Class A ordinary shares). The transaction is contractually denominated in US dollars, so deal figures are shown in US$; operating and balance-sheet figures are in ¥, with the company's own US$ conversions in parentheses.
The deal on the table
The buyer is Two Hearts Investments Limited, a wholly-owned subsidiary of Meituan (HKEX: 3690). It is acquiring all shares of Dingdong Fresh Holding Limited ("Dingdong Fresh BVI"), the entity that holds — through a chain of wholly-owned and majority-owned subsidiaries — substantially all of Dingdong's operations in China [1]. The consideration has two distinct parts, and they are worth keeping separate:
Source: FY2025 Annual Report, Item 4 [2]; Note 21 Subsequent Event [3].
Meituan pays US$717 million for the shares. Separately, before closing, Dingdong has the right to pull up to US$280 million of cash out of the China business (received by August 31, 2026), provided the business retains at least US$150 million of net cash for the buyer [4]. Together the company expects up to US$997 million [5]. The consideration is subject to adjustment for net cash, net working capital and debt-like items, and is payable in two installments: 90% at closing and the remaining 10% only after Dingdong settles the taxes on the sale [6].
The distinction matters. The US$280 million is not extra value from Meituan; it is Dingdong's own cash, moved from the subsidiary up to the parent before the sale. Only the US$717 million is new cash from an outside buyer. That framing also guards against a double-count: the up-to-US$997 million does not stack on top of the ¥3.98 billion (US$568.7 million) cash pile the balance sheet already shows — it largely converts it.
The cash is inside the business being sold
That converts a problem the earlier chapters flagged. Dingdong's headline cash — ¥3,976.8 million (US$568.7 million) of cash, restricted cash and short-term investments at the end of 2025 [7] — does not sit at the listed Cayman parent. The parent-only balance sheet holds just ¥1.3 million (US$188 thousand) of cash; its assets are almost entirely amounts due from subsidiaries [8].
Almost all of Dingdong's US$568.7m cash sat inside the China business it is selling (the listed parent held just US$188k and never dividended it up), so it reaches ADS holders only through the Meituan sale — and then only if a board on which founder Liang holds 80.9% of the vote on 25.2% of the economics distributes it, the same board that used ~US$1.2m of a US$20m buyback and has never paid a dividend.
Consolidated cash and investments (¥m)
Parent-only cash (¥m)
Source: FY2025 Annual Report — Liquidity and Capital Resources [9]; Note 20 Parent-Only Financial Information [10].
For a shareholder, this is what the sale changes. A Chinese operating subsidiary's cash reaches an ADS holder only if it is dividended or otherwise upstreamed through the Hong Kong and BVI holding chain — something Dingdong had never done: the subsidiaries paid no dividends to the parent in any period presented, and the company has never paid a dividend on its ordinary shares [11]. Some of that cash was also encumbered — ¥429.1 million (US$61.4 million) of time deposits was pledged as collateral for short-term borrowings at year-end [12]. The Meituan sale is the mechanism that turns trapped subsidiary cash into parent-level cash the company can actually distribute.
From proceeds to a per-ADS figure
Dingdong had about 354.3 million ordinary shares on an as-converted basis as of March 18, 2026 [13]; at two ADSs per three Class A shares [14] that is roughly 236 million ADSs. Against a recent ADS price near US$2.5, the equity is worth about US$600 million. The deal components translate to the following per-ADS figures:
Sources: deal terms, FY2025 Annual Report Item 4 [15]; share count [16]; ADS ratio [17]; recent ADS price per market data (approximate, not from filings).
Two deductions sit between the US$4.22 gross figure and cash in a holder's hand. The first is tax: the sale of an offshore-held Chinese business triggers non-resident indirect-transfer tax filings, and the SPA's structure — holding back 10% of the consideration (about US$72 million) until taxes are settled — is the company's own signal of the order of magnitude at stake. On an illustrative 10%–15% leakage for tax and transaction costs, post-tax proceeds would be roughly US$850–900 million, or about US$3.6–3.8 per ADS. The second is that management earmarked a substantial majority, not all, of the proceeds for return. Applying both, an illustrative net return lands near US$3.2–3.4 per ADS — still comfortably above the recent price, but the range is wide and depends on assumptions the filings do not pin down. The precise tax charge is the single largest unknown in this arithmetic.
What the plan returns to shareholders
On February 10, 2026 Dingdong said it intends to use a substantial majority of the sale proceeds for share repurchases and/or dividends once the transaction closes [18]. In the fuller press release that day, management quantified the intent as returning not less than 90% of the company's cash balance after closing — a materially firmer commitment than the phrase "substantial majority" alone conveys, though the final terms remain subject to board approval after the deal completes.
Before February 2026, the case for a capital return rested on hoping a founder-controlled board would voluntarily distribute cash it had never touched. Now there is a stated plan, a defined pool of cash, and a counterparty. The commitment is not yet binding — no buyback or dividend has been declared, and the terms are set only after closing — but it converts an open-ended governance question into one with a date and a number attached.
What remains after the sale
What a shareholder keeps if the deal closes is not "Dingdong minus China." It is a cash shell plus a small, loss-making international grocery operation, ring-fenced by a non-compete. The international business is retained and is not part of the sale [19]. Its scale is slight and its economics are negative: in the first quarter of 2026 the overseas business generated ¥139.4 million (US$20.2 million) of revenue — about 2% of the group — while posting a net loss of ¥71.4 million (US$10.4 million), a loss that widened almost 200% year over year as the company expands into new regions [20].
Source: Q1 FY2026 results, continuing-operations (overseas) segment [21].
The ring-fence is real: alongside the sale, Dingdong and founder Changlin Liang personally signed a five-year non-competition and non-solicitation covenant with Meituan, restricting the To-C fresh-grocery e-commerce business across Greater China [22]. So the standalone company cannot simply rebuild the business it sold. Whether the residual overseas operation is worth anything to a shareholder, or is a drag on the cash, is a genuinely open question; on current run-rate it consumes cash rather than adding value. Founder control also persists — Liang holds about a quarter of the economics (25.2%), but through Class B shares that carry super-voting rights he controls the vote [23] — so the capital-return plan runs through a board he controls, for better and worse. His economic stake aligns him with a distribution; his voting control means minority holders cannot compel one.
Closing risk and what would change the read
The transaction is unclosed and conditional, and as of mid-2026 it had not completed. It requires anti-monopoly clearance from China's SAMR, shareholder approval, completion of the overseas carve-out, the tax filings, and the absence of a material adverse effect [24]. Either party may walk if closing has not happened within twelve months of signing — by early February 2027 — for any reason not attributable to it [25]. Antitrust review is the binding condition to watch: Meituan is already a dominant force in China's instant-retail and food-delivery market, and its absorption of a fresh-grocery competitor is exactly the kind of combination SAMR scrutinizes. The recent ADS price near US$2.58 sits below the US$3.04 of cash consideration per ADS, and well below the US$4.22 gross figure.
One accounting point guards against reading the interim numbers too favorably. Once the China business was classified as held for sale, US GAAP stops depreciation on its long-lived assets, which lifted first-quarter 2026 net income by about ¥138 million (US$20.0 million); the company notes this benefit will recur every quarter until the deal completes [26]. Reported profit is therefore flattered by an accounting change, not by better grocery economics — a caution consistent with where the operating profit came from in the first place (The Financial Record).
The read from here: the sale, if it closes on its stated terms, resolves the value-versus-trap question in favor of value — it puts a real number on the cash and a plan under it. What would change that read is a failure or heavy re-cut at SAMR, a tax charge materially above the 10% holdback, or a board that closes the deal and then keeps the cash rather than distributing it. The next few quarters — SAMR's decision and the first concrete buyback or dividend authorization — are where this resolves.
Control and Capital Return
Dingdong's value case is a cash case, and the cash sits behind a gate only the founder can open. Almost all of Dingdong's US$568.7m cash sat inside the China business it is selling (the listed parent held just US$188k and never dividended it up), so it reaches ADS holders only through the Meituan sale — and then only if a board on which founder Liang holds 80.9% of the vote on 25.2% of the economics distributes it, the same board that used ~US$1.2m of a US$20m buyback and has never paid a dividend [1] [2] [3] [4] [5].
That cash is not a dividend already declared or an escrow funded for holders; it is a balance the board has been free to keep, and has kept every year to date. What the gate is worth is a spread: at a recent ADS price near US$2.6 — a market quote, not a filing figure — the up-to-US$4.22 per ADS of gross proceeds a completed sale could deliver (The Meituan Sale) is the bulk of the return on offer. It turns on a SAMR-cleared closing [6] and, after that, a distribution the founder-controlled board is under no obligation to make — the same board that, with a live US$20 million buyback and a half-billion-dollar balance, spent about US$1.2 million. If the sale breaks or the cash is simply retained, it re-traps at the subsidiary level and the ADS reverts toward its net-cash backing near US$1.88 (Close or Break). The strongest fact on the other side is dated: on February 10, 2026, after agreeing the sale, Dingdong said it intends to return not less than 90% of its post-closing cash to shareholders [7].
Figures are in Chinese renminbi (¥) unless marked US$. US$ equivalents in parentheses are the company's own conversions from its filings (roughly ¥7.0 per US$1). Percentages, share counts, and votes are unit-agnostic.
The governance risk at Dingdong is not that management drains the cash through pay. Executive cash compensation was ¥22.8 million (US$3.3 million) in 2025, the founder holds no options, and the filings disclose no related-party dealings beyond employment and the stock plan. The concern is narrower, and it sits at the gate: the pay is clean; the discretion over whether the cash is ever returned is not shared.
Pay is not where the money leaks
For a company whose bull case rests on a cash balance worth close to its market value, the first thing a skeptic checks is whether insiders are quietly extracting that cash. On the evidence, they are not. In 2025 Dingdong paid an aggregate of ¥22.8 million (US$3.3 million) in cash to all of its executive officers combined, and US$150,000 in total to its non-executive directors; it set aside nothing for pensions or retirement [8]. That cash figure is essentially flat against the ¥22.01 million (US$3.02 million) paid in 2024, and it is about a tenth of 2025 net income and roughly half a percent of the cash pile the case is built on [9].
The equity side tells the same story. Founder and chairman Changlin Liang has been awarded no options at all; the option grants sit with operating managers — CEO Song Wang, COO Yi Ding, and others — at exercise prices between US$0.00 and US$2.33, and all directors and executive officers together hold options over 4,550,849 shares, under 1.5% of shares outstanding [10]. Non-cash share-based compensation has fallen for two straight years, from ¥136.6 million in 2023 to ¥118.5 million in 2024 to ¥78.4 million (US$11.2 million) in 2025, as the post-IPO grants vest and are not fully replaced [11].
Source: FY2025 Annual Report (Form 20-F), Item 6 Compensation and Risk Factors [12] [13]. Executive cash for 2023 was not separately disclosed.
The related-party record is similarly clean. Item 7 of the annual report discloses no loans to the founder, no guarantees, and no purchases from founder-affiliated entities; its only entries point back to the employment agreements and the employee share plan [14]. For a China-based, founder-controlled ADR, the absence of tunneling is worth stating plainly, because it is not the norm.
One quarter of the economics, four-fifths of the vote
The alignment on pay does not carry through to control. As of December 31, 2025, Changlin Liang beneficially owned about 25.2% of the share capital but 80.9% of the voting power, through a dual-class structure in which his Class B shares carry 20 votes each to the Class A holders' one [15]. The Class B block — 54,543,800 shares — is held through DDL Group Limited and ultimately a family trust the founder directs [16]. The marquee IPO backers — General Atlantic (5.5%), SoftBank's Vision Fund (5.9%), and HongShan/Sequoia (4.7%) — hold only single-vote Class A and, on the arithmetic, cannot outvote the founder on anything [17].
Source: FY2025 Annual Report (Form 20-F), Risk Factors and Item 7 [18] [19].
Because Liang holds more than half the vote, Dingdong is a "controlled company" under NYSE rules and, as a Cayman-incorporated foreign private issuer, elects to follow home-country practice instead of several NYSE governance standards. It does not maintain a majority-independent board, an independent nominating committee, or a fully independent compensation committee, and it is exempt from the three-member minimum for audit committees [20]. In practice the six-person board has two independent directors, and the founder himself sits on the committee that sets executive pay [21].
Source: FY2025 Annual Report (Form 20-F), Item 6 Directors and Board Practices [22] [23].
The two independents are not decorative. Philip Wai Lap Leung, who chairs the audit committee and is the designated financial expert, spent three decades at Ernst & Young, latterly as managing partner for Greater China markets; Ed Yiu Cheong Chan, who chairs the compensation committee, was CEO of Walmart China and has sat on the boards of Yum China and Treasury Wine Estates [24]. A third director, Eric Chi Zhang, chairs General Atlantic's China business — a large aligned holder with a seat at the table [25]. Credible people occupy the oversight roles; the structure simply means their oversight sits beneath the founder's controlling vote.
The distribution record is thin
The through-line's open question is whether the cash reaches shareholders. The company's own history on that question is the most relevant evidence, and it is discouraging. Dingdong has never declared or paid a dividend since inception and states it has no present plan to; the board retains full discretion, and any dividend would in any case have to clear the cash up from PRC subsidiaries first [26].
The one channel it did open barely ran. In March 2025 Dingdong announced a share-repurchase program of up to US$20 million over the following year. By the time that window closed in March 2026 it had bought back 695,957 ADSs at an average of US$1.78 — about US$1.2 million, or roughly 6% of the authorization — while holding some US$569 million of cash [27].
Source: FY2025 Annual Report (Form 20-F), Item 16E [28].
There is a further wrinkle that blunts even that token effort. The shares Dingdong repurchased were not retired; they were designated as treasury stock, and in 2024 the company transferred 3,333,761 repurchased shares to EatBetter Holding Limited — an entity controlled by the founder and CEO — and to Glory Graze Holding Limited, controlled by a director, to fund employee option plans [29]. Buybacks that recycle into insider-controlled compensation vehicles return cash to employees, not a shrinking share count to public holders. On the historical record, Dingdong has returned almost nothing to its ADS holders.
What the capital-return promise rests on
Against that record stands a more recent development: on February 10, 2026, after agreeing to sell the China business to Meituan, Dingdong said it intends to use a substantial majority of the proceeds for share repurchases and/or dividends upon closing [30]. Company communications around the deal put the figure at not less than 90% of the post-closing cash balance. If honored on proceeds of up to roughly US$997 million (The Meituan Sale) — about US$4.22 per ADS gross against a recent price near US$2.6 — it accounts for most of the return on offer.
The weight the promise can bear is limited by three facts on this page. It is an expression of intent, not a binding obligation — no amount, form, or timetable is committed. It is contingent on a sale that, as of the latest filing, had not closed and still requires SAMR anti-monopoly clearance [31]. And whatever is ultimately distributed will be decided by a board on which one person holds four-fifths of the vote — the same board that, given a live US$20 million buyback and a half-billion-dollar cash balance, chose to spend about US$1.2 million.
The balanced read is that the alignment is better than the structure. The evidence argues against the crudest bear case — that insiders are looting the company — because the pay is trivial, the founder takes no options, the related-party ledger is clean, and genuinely qualified independents chair the audit and compensation committees. The evidence also argues against taking the capital return for granted: it is discretionary, unenforceable by minority holders, and set against a distribution history of one lightly-used buyback whose shares went to insider vehicles. What would move the read from hope to fact is narrow and observable — a board resolution after closing that authorizes a sized, dated dividend or tender. What would confirm the bear case is the mirror image: the sale closing, and the cash being retained or redeployed into the retained overseas business rather than distributed. Until one of those happens, the cash is real, and its route to an ADS holder runs through a single vote.
Instant Retail
The industry tailwind behind Dingdong was real, and large. China's on-demand fresh-grocery market grew from ¥3.5 billion in 2016 to ¥128.8 billion in 2020, and the frontline-fulfillment-grid model Dingdong pioneered was the fastest-growing corner of it. Yet Dingdong's revenue has sat flat near ¥24 billion since 2022, its city count has shrunk, and its margin has stayed at breakeven. The tailwind arrived; it was captured by companies far larger than Dingdong. That gap — a booming market and a stalled participant — is what this chapter examines.
Dingdong reports in Chinese renminbi (¥); its ADSs trade in US dollars on the NYSE. Market and revenue figures are shown in ¥, with the company's or the filings' own US$ conversions in parentheses where available. Growth rates, penetration rates and market shares are unitless and unchanged.
A market that was supposed to compound
At the 2021 IPO, the case for Dingdong rested on penetration. Fresh groceries — vegetables, fruit, meat, seafood — were still bought overwhelmingly in wet markets and supermarkets; online penetration of the category was only 8.1% in 2020, up from 2.8% in 2016, and the market researcher CIC projected it would reach 17.8% by 2025 [1]. The whole fresh-groceries and daily-necessities retail market was put at ¥11.1 trillion in 2020, forecast to grow to ¥15.2 trillion by 2025 [2].
Source: IPO Prospectus (Form 424B4), Industry — CIC estimates, 2016–2020 actual and 2021–2025 forecast [3].
The sharper number was the delivery layer on top of that penetration. On-demand e-commerce — the businesses that deliver fresh groceries within hours of an order — grew at a 146.7% compound rate from ¥3.5 billion in 2016 to ¥128.8 billion in 2020, and CIC forecast a further 31.8% compound rate to ¥511.8 billion by 2025 [4]. Within that, Dingdong's specific niche — the self-operated "frontline fulfillment grid" model, in which a company owns its supply chain and neighbourhood stations rather than acting as a marketplace — was projected to be the fastest-growing of all, compounding 49.2% a year from ¥30.8 billion in 2020 toward ¥227.7 billion by 2025 [5].
And Dingdong led it. By GMV it held a 10.1% share of on-demand fresh-grocery e-commerce in 2020, ranked first for growth among the top five platforms, first by GMV in the Yangtze River Delta, and second nationally [6]. Its own GMV had gone from ¥741.7 million in 2018 to ¥13,032.2 million (US$1,989.1 million) in 2020 [7]. A leader, in the fastest-growing slice of a market forecast to nearly quadruple. The market grew broadly as forecast; the leadership Dingdong held in 2020 did not.
What actually happened to the growth
Dingdong's revenue climbed with the market through 2022, then stopped. It reached ¥24,221.2 million in 2022, fell 17.5% to ¥19,971.2 million in 2023 as the company pulled out of unprofitable cities, recovered to ¥23,066.3 million in 2024, and grew 5.6% to ¥24,359.9 million in 2025 — leaving it 0.6% above where it stood three years earlier [8] [9].
Source: FY2021 Annual Report [10]; FY2022 Annual Report, Consolidated Statements of Operations [11]; FY2025 Annual Report, Consolidated Statements of Operations [12].
The physical footprint tells the same story in reverse. At the end of 2021, Dingdong ran roughly 1,300 frontline fulfillment stations across more than 35 cities, serving about 8.8 million average monthly transacting users [13]. By the end of 2025 it operated more than 1,100 stations across 28 cities [14]. Fewer cities, fewer stations, flat revenue — through the exact window in which CIC had projected the company's niche to more than double. The turn to profit that earlier chapters documented (The Financial Record) was bought with this retreat: Dingdong stopped chasing the market and defended a smaller one.
The three-front war
The market kept growing; what changed was who was fighting for it. Dingdong's own filing names three sets of competitors: other fresh-grocery e-commerce players, the general merchandise platforms, and traditional retailers moving online — and concedes plainly that some of them "may have longer operating histories, greater brand recognition, better supplier relationships, larger customer bases or greater financial, technical or marketing resources" [15]. In practice that is a war on three fronts, all fought by companies with balance sheets many times Dingdong's:
The first front is community group-buying — next-day pickup of heavily subsidised staples — run at national scale by Pinduoduo's Duoduo Grocery and Meituan. The second is platform, or marketplace, delivery, where an intermediary carries orders from existing shops without owning inventory; CIC classed this as a distinct model from Dingdong's self-operated one [16]. The third, and most direct, is the frontline-station model itself: on the Q2 2024 call an analyst noted that "Meituan is extending the station to more cities" and asked Dingdong how it viewed the threat [17]. A competitor that copies the model and carries effectively unlimited capital tests the moat directly.
By 2025 the fight had a name inside Dingdong's own remarks. Founder Changlin Liang told investors that "recent competition within instant retail has garnered widespread attention" and that "the battle for users and traffic is fierce" [18]. Grocery delivery in China in 2025 was not a quiet compounding market. It was a subsidy contest among Meituan, Alibaba and JD, and a self-funded ¥24 billion operator could not set the price.
Dingdong's answer: narrow and deep
Dingdong's response was not to match the subsidies but to leave the mass market to them. Liang has been explicit that the low-price playbook does not fit fresh food: the traditional retail principle of "achieving scale by offering low prices and then leveraging that scale to drive down procurement costs… is not applicable to the fresh grocery industry," he argued, casting Dingdong instead as "primarily a fresh grocery supply chain business" rather than a retailer competing on traffic [19]. The strategy has a label — "narrow and deep," under a "Love of Quality" repositioning — and it aims squarely at higher-spending households rather than the marginal, subsidy-chasing shopper [20].
The metrics management chose to disclose describe that narrower base. In June 2025, the roughly 30% of users it classes as "good users" — quality-led, price-insensitive — generated 68.5% of GMV and reordered at least eight times a month, against a 4.4-times average [21]. The clearest evidence of a real, hard-to-copy advantage is private label: launched only in July 2020, Dingdong's own brands reached around 20% of total GMV by 2025 across more than 23 labels and roughly 5,000 SKUs [22]. Private label is where the self-operated supply chain earns its keep — it is margin a marketplace cannot easily replicate, because it requires owning procurement and product development rather than renting shelf space.
Private label — % of 2025 GMV
'Good users' — % of GMV (Jun 2025)
Good-user orders / month
Source: FY2025 Annual Report, Private Label Products [23]; Q2 FY2025 Earnings Call [24].
That is a coherent niche strategy, and it is the reason the business reached profitability at all. But it is a defensive one. It concedes the volume the 2021 thesis was built on, and it rests on execution — supply-chain skill, product development, regional density — rather than on switching costs that lock a customer in. A "good user" who reorders eight times a month does so out of preference, not obligation; nothing stops that household opening Meituan or Freshippo the following week.
The Moat, Measured
Held to the standard that an advantage must appear in the numbers, Dingdong's is narrow. Its supply chain and private label are genuine and specific to the company; they show up as a plateauing 20% of GMV and as a business that survived a shakeout that killed weaker frontline-grid operators. But the same numbers bound the moat: revenue flat for three years, share ceded as the market grew, and a core grocery margin that runs at breakeven once government subsidies and interest income are stripped out (The Financial Record). A moat that lets you survive a price war but not grow through it is real, and narrow.
The most authoritative read on that moat is not Dingdong's or this report's — it is Meituan's. The company with the deepest instant-retail pockets and its own expanding station network chose, in February 2026, to buy Dingdong's China business outright for up to roughly US$997 million rather than continue competing with it (The Meituan Sale) [25]. That transaction cuts both ways, and both should be held at once. It confirms the assets are worth more to a strategic owner than the market credited — the density, the supply chain and the ~10-million-user base have real value inside a larger network. It also confirms the standalone case had a ceiling: the founder, offered the choice between fighting the giants for another decade or selling to one of them, chose to sell, and to sign a five-year non-compete on Greater China fresh grocery in the process (The Meituan Sale) [26].
For an investor weighing the value-versus-trap question, the competitive read points one way on the operating business and complicates the whole. As a standalone compounder, Dingdong is a narrow-moat participant in a market whose growth flows to better-capitalised rivals — the durability the bull case needs is not there in the numbers. What makes the situation interesting is precisely that the operating business is being converted to cash by a buyer who values the assets more than the market did; the investment question turns less on whether Dingdong can win the instant-retail war and more on whether that cash reaches shareholders. The evidence that would change the competitive read is straightforward to watch: private label breaking meaningfully above 20% of GMV, or revenue and city count turning up again — neither of which has happened, and both of which the pending sale would render moot.
Operating Value
Meituan agreed to pay US$717m of equity — up to ~US$997m all-in, about US$4.22 per ADS — for a China grocery operation that on its own earned approximately nothing in FY2025 (a RMB13.3m core operating loss before other income; reported profit was RMB145.0m of subsidies-driven other income plus RMB108.8m of interest on cash) and carries negative ~US$272m of operating net assets, so the per-ADS value case rests on a strategic/synergy mark that evaporates on a deal break. The equity consideration and the retained-cash terms come straight from the sale agreement [1]; the reported profit was subsidies and interest, not groceries [2]; and The Meituan Sale builds the per-ADS waterfall. A sophisticated, adjacent operator still paid up for the roughly 1,100-station fulfillment grid [3] and the ~20%-private-label supply chain [4], so a narrow moat is not the same as no value. Three marks price that same business, and they answer differently: the strategic buyer at US$717 million of equity, the public market — pricing the whole company near its cash — at well under US$0.2 billion of enterprise value for everything below the balance sheet, and the earnings at essentially zero. The gap between those marks is what a holder inherits if the deal breaks.
Operating figures are in Chinese renminbi (¥) unless marked US$, with the company's own US$ conversions (roughly ¥7.0 per US$1) in parentheses. The Meituan consideration and per-ADS figures are stated in US dollars because the transaction and the ADSs are dollar-denominated. Percentages, share counts, and per-ADS values are unit-agnostic.
Three marks on one business
The earlier chapters valued Dingdong through its cash and its deal. The Financial Record established the earnings; The Meituan Sale established the transaction; Close or Break set a cash-backed floor for the case where the sale falls through. What none of them isolated is the operating business as an asset in its own right — the 28-city grocery network stripped of the cash it sits on and the buyer waiting to take it. That standalone value is the open question a holder faces if the deal terminates around February 2027, because at that point the cash re-traps and what remains is the business itself.
Meituan agreed to pay US$717 million in cash for all the shares of Dingdong Fresh BVI, the entity that holds substantially all of the China operations, with the international business carved out and retained [5]. On the report's share count that consideration is about US$3.04 per ADS (The Meituan Sale) [6]. That is one mark: what a sophisticated, adjacent operator will pay for the density.
The second mark is the market's. At a recent ADS price near US$2.3–2.6 the whole company is worth roughly US$0.5–0.6 billion, against consolidated cash, restricted cash and short-term investments of ¥3,976.8 million (US$568.7 million) and own funds net of borrowings of ¥3,140.3 million (US$449.1 million) [7]. Netting the cash out of the market value leaves well under US$0.2 billion of enterprise value for the entire operating business — China grocery plus the loss-making overseas arm together.
The third mark is what the business earns. That one is close to zero, and it is worth building from the income statement rather than asserting.
Source: FY2025 Annual Report (Form 20-F), MD&A results of operations and consolidated statement of operations [8] and other operating income note [9].
FY2025 revenue of ¥24,359.9 million (US$3,483.4 million) met total operating costs and expenses of ¥24,373.2 million, so the grocery operation ran at a loss of ¥13.3 million before any other income [10]. The ¥231.7 million (US$33.1 million) of reported net income was assembled almost entirely from two sources that are not the grocery business: ¥145.0 million (US$20.7 million) of other operating income, whose growth came mainly from a ¥26.4 million rise in government subsidies, and ¥108.8 million of net interest earned on the cash pile itself [11]. Without the subsidies and the interest on cash that the deal would hand away, the grocery operation contributes almost nothing to earnings, so its standalone value on an earnings basis is negligible.
So the three marks stand a long way apart: a strategic buyer at US$717 million of equity, the public market at under US$0.2 billion of enterprise value for the whole operating company, and the earnings at essentially zero. The market's mark and the earnings mark agree with each other. Only the strategic mark is high, and the strategic mark is the deal.
What the operating business actually owns
The held-for-sale schedule the company filed with its Q1 2026 results makes the point sharper, because it lays out the China business as a self-contained set of assets and liabilities.
Source: Q1 FY2026 results, schedule of assets and liabilities held for sale of the China business [12].
The China business carried net assets of ¥896.2 million (US$129.9 million) at 31 March 2026 [13]. But that figure is cash. Inside it sit ¥3,448.7 million (US$500.0 million) of cash, restricted cash and short-term investments against ¥674.3 million (US$97.8 million) of short-term borrowings — about ¥2,774.4 million (US$402.2 million) of net cash. Take the net cash out and the operating side of the business — inventory, receivables, fulfillment equipment and leases, set against supplier payables, lease liabilities and customer advances — nets to roughly negative ¥1,878 million (negative US$272 million).
That negative figure is not distress. It is the signature of a self-operated grocery model financed by float: suppliers and landlords fund the working capital, so the operation carries more operating liabilities than operating assets. The practical consequence for valuation is that there is no asset backing beneath the cash. Whatever the operating business is worth above zero is franchise value — the network, not the balance sheet.
There is a real network to value. As of end-2025 Dingdong ran a self-operated grid across 28 cities, with more than 40 regional processing centers and over 1,100 frontline fulfillment stations [14], and private-label products it develops and largely manufactures itself contributed around 20% of GMV, and over 35% in non-fresh categories [15]. That density and supply chain is precisely what a strategic buyer building an instant-retail network would pay for, and what a public investor discounting near-zero earnings will not. The two marks are looking at the same assets and pricing different things — synergy on one side, cash flow on the other.
What a strategic pays versus what the market pays
Reading the strategic mark cleanly means separating the equity cheque from the cash inside the business. Meituan's US$717 million is consideration for the equity; the mechanics of the upstreamed cash and the retained-cash floor are laid out in The Meituan Sale. Netting at least US$150 million of retained net cash out of the equity cheque puts the enterprise value Meituan places on the operating business on the order of US$0.5–0.6 billion [16]. The market, by the same net-of-cash logic, places under US$0.2 billion on the entire operating company — and because the overseas arm inside that figure loses money, the market's implied mark on the China operation alone is lower still.
Strategic Mark (US$bn EV)
Market Mark (US$bn EV)
Earnings Mark (US$bn EV)
Sources: strategic mark derived from deal terms, US$717m equity less at least US$150m retained net cash [17]; market mark derived from a recent ADS price near US$2.3–2.6 (approximate, not from filings) net of own funds per the FY2025 balance sheet [18]; earnings mark from FY2025 results of operations [19]. The BigValues show the same three columns left to right; each is illustrative and moves with the retained-cash adjustment and the ADS price.
The strategic mark is roughly four times the market mark and, on earnings, effectively unbounded above zero. A gap that wide is not a mispricing to be arbitraged in the ordinary way. It is the difference between a synergy buyer and a financial one: Meituan is paying for what the network is worth inside its own instant-retail operation — the same competitive dynamic Instant Retail traced — not for the discounted cash flows of a standalone grocer. That distinction decides what happens to the value on a break.
If the deal breaks
If the sale terminates, the strategic mark does not transfer to the tape: the US$3.04 per ADS of strategic consideration falls away, the bidder walks, the five-year Greater China non-compete that binds Dingdong and its founder never takes effect, and the operating business re-consolidates at the value the market and the earnings assign it — close to zero enterprise value above the cash. On the standalone evidence set out above, the operating business adds little above the cash-backed floor, which nets to roughly US$1.88 per ADS on own funds and US$2.41 per ADS on gross cash — the floor Close or Break reconciles in full against the tax leakage. The retained overseas arm subtracts from it, having lost ¥71.4 million (US$10.4 million) in Q1 2026 alone, nearly triple the year-earlier loss [20]. The GAAP profit reported since the sale was announced is also partly an artifact: held-for-sale classification stopped depreciation on the China assets, lifting quarterly net income by about ¥138 million (US$20.0 million), which reverses when the deal either closes or dies [21].
The read here is that the operating business, on its own economics, is worth little more than the cash it holds, and that the US$717 million is a strategic price that largely evaporates on a break. The strongest fact against that read is the price itself: a breakeven operation is one thing, but a 1,100-station network with a 20%-private-label mix that a well-informed strategic agreed to pay roughly half a billion dollars of enterprise value for is not obviously worth nothing. If the sale fails on antitrust grounds — SAMR clearance is the binding condition, and it turns on Meituan's own dominance, not on Dingdong's assets — then the network and its appeal survive intact, and another, less conflicted acquirer could in principle bid. The corpus carries no evidence of a competing bidder, so that optionality is real but unquantified; it is upside to the floor, not part of it. What would move the read is either a second bid emerging, or the core grocery line turning durably profitable before subsidies and interest — an inflection the eight-quarter record has not yet shown.
One element of the floor is firmer than the operating value: the downside is bounded by cash, not by solvency. The company holds ¥3,140.3 million (US$449.1 million) of own funds net of borrowings, carries no material long-term debt, and its negative working capital is supplier float rather than a funding gap [22]. Even standalone and even loss-making at the overseas arm, the balance sheet does not point toward a forced restructuring; the accumulated ¥2,740.7 million of tax losses it carries are fully reserved and reflect a decade of cash burn now behind it, not a claim on the future [23]. The risk this chapter isolates is not that the cash disappears but that, absent the deal, the operating business never adds meaningfully to it, leaving the cash worth what it was before Meituan bid and reachable by ADS holders only at the subsidiary level.
Margin Trajectory
Dingdong's operating turnaround is real, but it has already crested. The three-year core-line arc — a RMB132.4 million loss in 2023 to a RMB121.9 million profit in 2024 and back to a RMB13.3 million loss in 2025, once subsidies and interest are set aside (The Financial Record) — resolves into a sharper quarterly pattern: the recovery peaked in the second half of 2024 and reversed through 2025. The counter-fact is that cash generation has not crested.
The core operating line, three years
The core line removes the two items that do not come from selling groceries — the RMB145.0 million of other operating income (largely government subsidies) and the RMB108.8 million of net interest on the cash pile. What is left is the operation itself, and its record is a clean arc: a widening loss narrowed, turned to profit, and turned back.
Source: derived from the FY2025 consolidated statements of operations; core operating line = total revenues less total operating costs and expenses, excluding other operating income [1].
The 2024 figure is the genuine inflection: total revenues of RMB23,066.3 million against operating costs of RMB22,944.3 million, a RMB121.9 million operating profit [2]. By 2025 that had reversed: RMB24,359.9 million of revenue no longer covered RMB24,373.2 million of costs, and the reported RMB231.7 million of net income was assembled entirely from the RMB145.0 million subsidy line and RMB108.8 million of interest [3]. The operating business that a deal-break would leave behind (Operating Value) is the one charted above, and its direction of travel in 2025 was down.
Where it turned, and where it turned back
The annual figures blur a sharper quarterly pattern. The core operating line is seasonally low in the first quarter — Chinese New Year and softer food prices — and strongest in the third. Tracking each quarter against the same quarter a year earlier removes that seasonality, and the same-quarter comparison is where the reversal is unambiguous.
Source: derived from Dingdong quarterly results releases, Q1 2023–Q4 2025; core operating line = total revenues less total operating costs and expenses. Representative quarters: 3Q24 [4], 4Q24 [5], 3Q25 [6], 4Q25 [7].
The peak was the third quarter of 2024, when the core line reached a RMB99.8 million profit on GAAP income from operations of RMB110.5 million [8]. A year later the same quarter earned RMB40.8 million at the core line, income from operations more than halved to RMB59.3 million, and non-GAAP net income fell from RMB161.6 million to RMB101.3 million [9]. The fourth quarter shows the same shape more starkly: a RMB57.0 million core profit in 2024 [10] became a RMB9.9 million core loss in 2025, with GAAP income from operations down from RMB61.5 million to RMB12.0 million and the reported net margin at 0.5% [11]. The recovery did not hold for a full year.
What moved the margin
The deterioration was not a cost problem. Fulfillment expense — the frontline stations and delivery riders that are the model's largest controllable cost — kept getting more efficient, falling to 21.9% of revenue in 2025 from 22.0% in 2024 and 23.5% in 2023 [12]. What gave way was gross margin.
Source: derived from Dingdong quarterly results releases; ratios are quarter revenue-weighted [13], [14].
Full-year gross margin fell from 30.1% in 2024 to 29.2% in 2025 [15], and the second quarter of 2025 marked the low at 28.8%. Management attributes the pressure to falling food prices — the declining CPI of pork, eggs and vegetables — in a market where three well-funded platforms are subsidising instant grocery delivery [16]. The roughly one point of gross margin given up in 2025 is worth about RMB230 million on RMB24 billion of revenue — enough to overwhelm the modest fulfillment savings and tip the core line back below breakeven. The price war (Instant Retail) shows up first, and most clearly, in this line.
Volume did not rescue it. GMV growth, positive year-over-year for eight straight quarters, decelerated to 0.1% in the third quarter of 2025 and 2.4% in the fourth, and revenue growth slowed to 1.9% and 5.7% respectively [17], [18]. Flat volume and thinner margin fell together.
The held-for-sale distortion
The most recent quarter appears to break the trend, and the appearance is an accounting artifact. In the first quarter of 2026, with the China business reclassified as a discontinued operation held for sale under the pending Meituan sale (The Meituan Sale), its reported income from discontinued operations jumped from RMB3.3 million a year earlier to RMB218.0 million [19], and net income for the China business rose 643.5% [20].
That step-up is not an operating recovery. Once assets are classified as held for sale, US GAAP stops recording depreciation and amortization on them. The company states this lifted quarterly net income by approximately RMB138 million (US$20.0 million), and that it will keep doing so every quarter until the Meituan deal closes. Fulfillment expense fell to 20.4% of China revenue overnight, a move no prior quarter's operating trend supports.
Source: Q1 2026 results — cessation of depreciation on held-for-sale assets [21].
Adjusting the China business's RMB162.1 million first-quarter core operating profit for that roughly RMB138 million of ceased depreciation leaves an underlying figure much closer to the breakeven the prior eight quarters describe [22]. The last quarter that reads the operating trajectory cleanly is the fourth quarter of 2025, and it reads as a 0.5% net margin sliding toward zero [23].
What the trajectory implies
For an investor weighing the deal-break case, the direction of the operating line matters as much as its level. A business earning approximately nothing but improving would offer a margin-recovery cushion beneath the cash floor. Dingdong's is not improving: on the same-quarter evidence through 2025, the core line is getting thinner. The margin of safety sits in the cash and the strategic bid, not in an operating recovery that the numbers do not yet show.
The read has a real counterweight. The business remained solidly cash-generative throughout the margin compression — the fourth quarter of 2025 was its tenth consecutive quarter of positive operating cash flow, at RMB0.20 billion [24] — and the pressure is priced, not operational: fulfillment efficiency kept improving, and the gross-margin squeeze tracks a food-deflation cycle that will not run forever. A stabilisation in food CPI could restore a point of gross margin and, with it, a thin core profit. What would change this chapter's read is two or more quarters, once the held-for-sale accounting is behind the numbers, of a core operating line back above breakeven without leaning on subsidies. Through the end of 2025, the trend pointed the other way.
Close or Break
Everything the earlier chapters established resolves into two states of the world. If the Meituan sale closes, an illustrative net distribution lands above the recent ADS price across almost the entire plausible range of the variable the outcome is most sensitive to — the PRC transfer tax. If it breaks, the ADS reverts toward its cash backing near US$1.9–2.4 and the value-versus-trap question reopens, with the cash real but re-trapped. The spread between those states, and the dated events that collapse it, are what a holder is actually trading.
Operating figures are in Chinese renminbi (¥) unless marked US$, with the company's own US$ conversions (roughly ¥7.0 per US$1) in parentheses. Per-ADS deal figures are stated in US dollars because the transaction and the ADSs are dollar-denominated. Percentages, share counts, and per-ADS values are unit-agnostic.
Two states, priced into one number
The recent ADS price is near US$2.6. That already sits below the US$3.04 per ADS of pure cash consideration Meituan agreed to pay, let alone the US$4.22 per ADS of gross proceeds the company expects (The Meituan Sale) [1]. A price below the cash portion of an announced deal is the market pricing a probability: some weight on the sale closing on its terms, some on it breaking, netted against the tax leakage and the time until cash arrives. The two states are worth valuing separately rather than blending, because they are discontinuous — a holder ends up in one or the other, not the average.
Recent ADS Price (US$)
Illustrative Net if Deal Closes (US$/ADS)
Cash Backing if Deal Breaks (US$/ADS)
Sources: recent price per market data (approximate, not from filings, ~US$2.6 in April 2026); close-case midpoint derived from deal terms, FY2025 Annual Report Item 4 [2]; break-case cash backing derived from the FY2025 balance sheet [3].
The BigValues read left to right as the two edges around today's price: the market pays US$2.58 for a claim that is worth roughly US$3.2 if the sale completes near its stated terms and roughly US$1.9 — its cash backing — if it does not. The rest of this chapter builds each edge from the evidence and lays out what moves the odds between them.
If the deal closes: the tax sets the number
The closing value is most sensitive to one unknown. Between the US$4.22 per ADS of gross proceeds and cash in a holder's hand sit two deductions: the tax and transaction cost of disposing of an offshore-held Chinese business, and the fact that management earmarked "a substantial majority," not all, of the proceeds for return [4]. The Share Purchase Agreement holds back 10% of the consideration until taxes are settled, which is the company's own signal of the order of magnitude rather than a disclosed charge [5]. Because that charge is not disclosed, the honest way to present the closing value is as a sensitivity, not a point estimate.
Source: derived from deal terms (up to US$997 million gross proceeds; ~236 million ADS), FY2025 Annual Report Item 4 [6]; gross-proceeds bridge per The Meituan Sale; share count [7]; ADS ratio [8].
The table's message is that the closing case is robust to the tax across most of its plausible band. At the 90%-return commitment management has signalled, a holder nets above the recent US$2.6 price at every leakage rate up to about 30% — and only a punitive combination of a 30%-plus effective charge and less-than-full return pulls the outcome down to today's price. China's standard withholding rate on a non-resident's indirect transfer of a Chinese business is 10%, the same fraction the SPA holds back pending tax settlement; even an all-in 20% leakage for tax plus transaction costs leaves roughly US$3.0 per ADS at a 90% return. The closing case therefore does not need a benign tax outcome to clear the current price; it needs the deal to close at all.
One caveat: up to US$280 million of the US$997 million headline is Dingdong's own pre-existing cash upstreamed before closing, not new money from Meituan, so the incremental cash a shareholder gains is closer to the US$717 million external consideration — the bridge is derived in full in The Meituan Sale [9].
If the deal breaks: back to the cash floor
The termination case is the mirror image. Either party may walk if closing has not occurred within twelve months of signing — by early February 2027 — for any reason not attributable to it [10]. If that happens, a holder is left with the pre-deal company: ¥3,976.8 million (US$568.7 million) of cash, restricted cash and short-term investments, against which sit ¥871.5 million of short-term borrowings, leaving net cash near ¥3.1 billion (US$444 million) [11] [12].
Source: cash and borrowings from the FY2025 balance sheet [13] [14]; recent price per market data (approximate).
The gross cash is about US$2.41 per ADS and the net cash about US$1.88 — so the recent US$2.6 price sits at roughly the gross-cash line. That is the pre-announcement picture the stock traded on: a business priced at close to its cash. The break case does not obviously imply a large loss from here, because the cash is real. What it removes is the mechanism. Without the sale, that cash returns to being trapped one or two holding tiers below the ADS — the listed Cayman parent held just ¥1.3 million (US$188 thousand) of cash directly, the subsidiaries have never paid it a dividend, and the company has never declared one (Control and Capital Return) [15]. A founder-controlled board with no distribution record would again hold discretion over cash it has historically kept. The value-trap reading — cash that is genuine but never reaches the holder — is precisely the deal-break state.
What the break case forfeits is the deal premium itself. Meituan agreed to pay US$717m of equity — up to ~US$997m all-in, about US$4.22 per ADS — for a China grocery operation that on its own earned approximately nothing in FY2025 (a RMB13.3m core operating loss before other income; reported profit was RMB145.0m of subsidies-driven other income plus RMB108.8m of interest on cash) and carries negative ~US$272m of operating net assets, so the per-ADS value case rests on a strategic/synergy mark that evaporates on a deal break [16]. Operating Value derives that standalone value in full; here the point is only that a break withdraws the strategic mark and leaves the holder the cash, not the premium.
Two facts make the break floor softer than the cash figures alone suggest. The operating business the holder re-inherits is roughly breakeven at the core, having ceded its niche's growth to better-capitalised rivals (Instant Retail); and the retained overseas business is a live cash drain, posting a ¥71.4 million (US$10.4 million) net loss in the first quarter of 2026, a loss that widened almost 200% year over year [17]. Neither is large against the cash, but both argue that a break resets the stock toward — not above — its cash backing.
Reconciling the threads
The two states pull the same facts in opposite directions. Setting them side by side is the clearest way to see what each shared fact is worth depending on which way the deal goes.
Sources: deal terms and capital-return intent, FY2025 Annual Report Item 4 and Q1 FY2026 results [18] [19]; ownership [20]; overseas segment [21].
The through-line's two labels map onto the two columns: the closing column is the margin-of-safety case realised, and the break column is the value trap. What decides which one a holder gets is not another fact about the business — it is a small set of dated events.
The delisting overhang, sized
One risk the earlier chapters carried forward deserves to be right-sized, because it is smaller than the label "China ADR" implies. Dingdong is not currently a Commission-Identified Issuer under the Holding Foreign Companies Accountable Act. It was named one in May 2022 after its first 20-F, but the PCAOB vacated its determination in December 2022 and removed mainland China from the list of jurisdictions it could not inspect; the company does not expect to be identified again on current filings [22]. Delisting under the Act requires being identified for two consecutive years, so the risk is a forward one tied to Sino-U.S. relations and the PCAOB's annual redetermination, not a live clock [23].
The structure is also cleaner than the typical China ADR. Dingdong holds its operating companies through a chain of directly owned equity — the Cayman parent owns a BVI holding company, which owns a Hong Kong company, which owns the mainland operating subsidiaries at 100% (one at 91.67%), with no variable-interest entity or contractual-control arrangement standing in for ownership [24]. That matters for both states: it is why Meituan can buy the China business by buying a BVI company's shares, and it means the residual entity a holder keeps in the break case is a direct-equity holding company, not a stack of contracts over assets someone else legally owns. The delisting and structure overhangs are real tail risks, but on the current record they are not the binding constraint on either scenario.
What to watch
The scenarios collapse into fact on a short list of dated, checkable events. Each is falsifiable — a specific filing item or authorization, with a threshold that would move the read.
Sources: closing conditions and termination right, FY2025 Annual Report Item 4 and Note 21 [25] [26]; upstream mechanics [27]; held-for-sale accounting [28]; HFCAA status [29].
Antitrust review is the event that carries the most decision value. Meituan is already dominant in China's instant-retail and food-delivery market, and its absorption of a fresh-grocery competitor is the kind of combination SAMR scrutinizes — yet Dingdong is a small and shrinking player in that market, which cuts the other way. As of the first-quarter 2026 results the transaction had not completed and clearance was still outstanding [30]. The other events are confirmations rather than surprises: the US$280 million upstream and the shareholder vote should clear if the deal is progressing, and the first actual buyback or dividend authorization is the moment the capital-return intent stops being a press release and becomes cash — the same authorization the founder's board has, on its prior record, been slow to grant against a half-billion-dollar balance (Control and Capital Return) [31].
The read from the two states together: the position is a bet on SAMR clearance and the transfer tax, set against a downside anchored — but not guaranteed — by cash near today's price. What would move it toward the closing value is clearance plus a board resolution sizing the return; what would move it toward the break value is a SAMR block or heavy remedy, a tax charge well above the 10% holdback, or a board that closes the deal and then keeps the cash. Those are the things to watch, and they are checkable one filing at a time.